Qruise Logo

QruiseOS

Rapid automated bring-up for quantum

bring-up
Accelerated bring-up
Significantly reduce the time and effort required to bring a quantum device online
recalibration
Ongoing recalibration
Combat drift to maintain the performance and reliability of your system
characterisation
Autonomous characterisation
Unlike human researchers, QruiseOS never sleeps, allowing you to run experiments 24/7
secure
Flexible & secure deployment
Install QruiseOS on-premises, in a fully offline, secure and private infrastructure

QruiseOS is our automated bring-up platform for the rapid characterisation, calibration, and optimal control of quantum devices.

It enables users to connect characterisation experiments to a model database, define sequences and dependencies between them, and execute these either in automated batch mode or interactive debugging mode. With access to over 40 standard experiments - or the option to integrate custom ones - QruiseOS offers maximum workflow flexibility. The comprehensive QruiseOS Dashboard allows users to submit jobs, monitor key metrics, review past runs, and quickly identify and investigate anomalies.

QruiseOS integrates seamlessly with quantum hardware via APIs from control electronics software and supports cloud-based, as well as on-premises, workflows by generating a Qiskit-compatible quantum service. In this way, QruiseOS streamlines bring-up and accelerates the development of next-generation quantum technologies.

40+ characterisation experiments
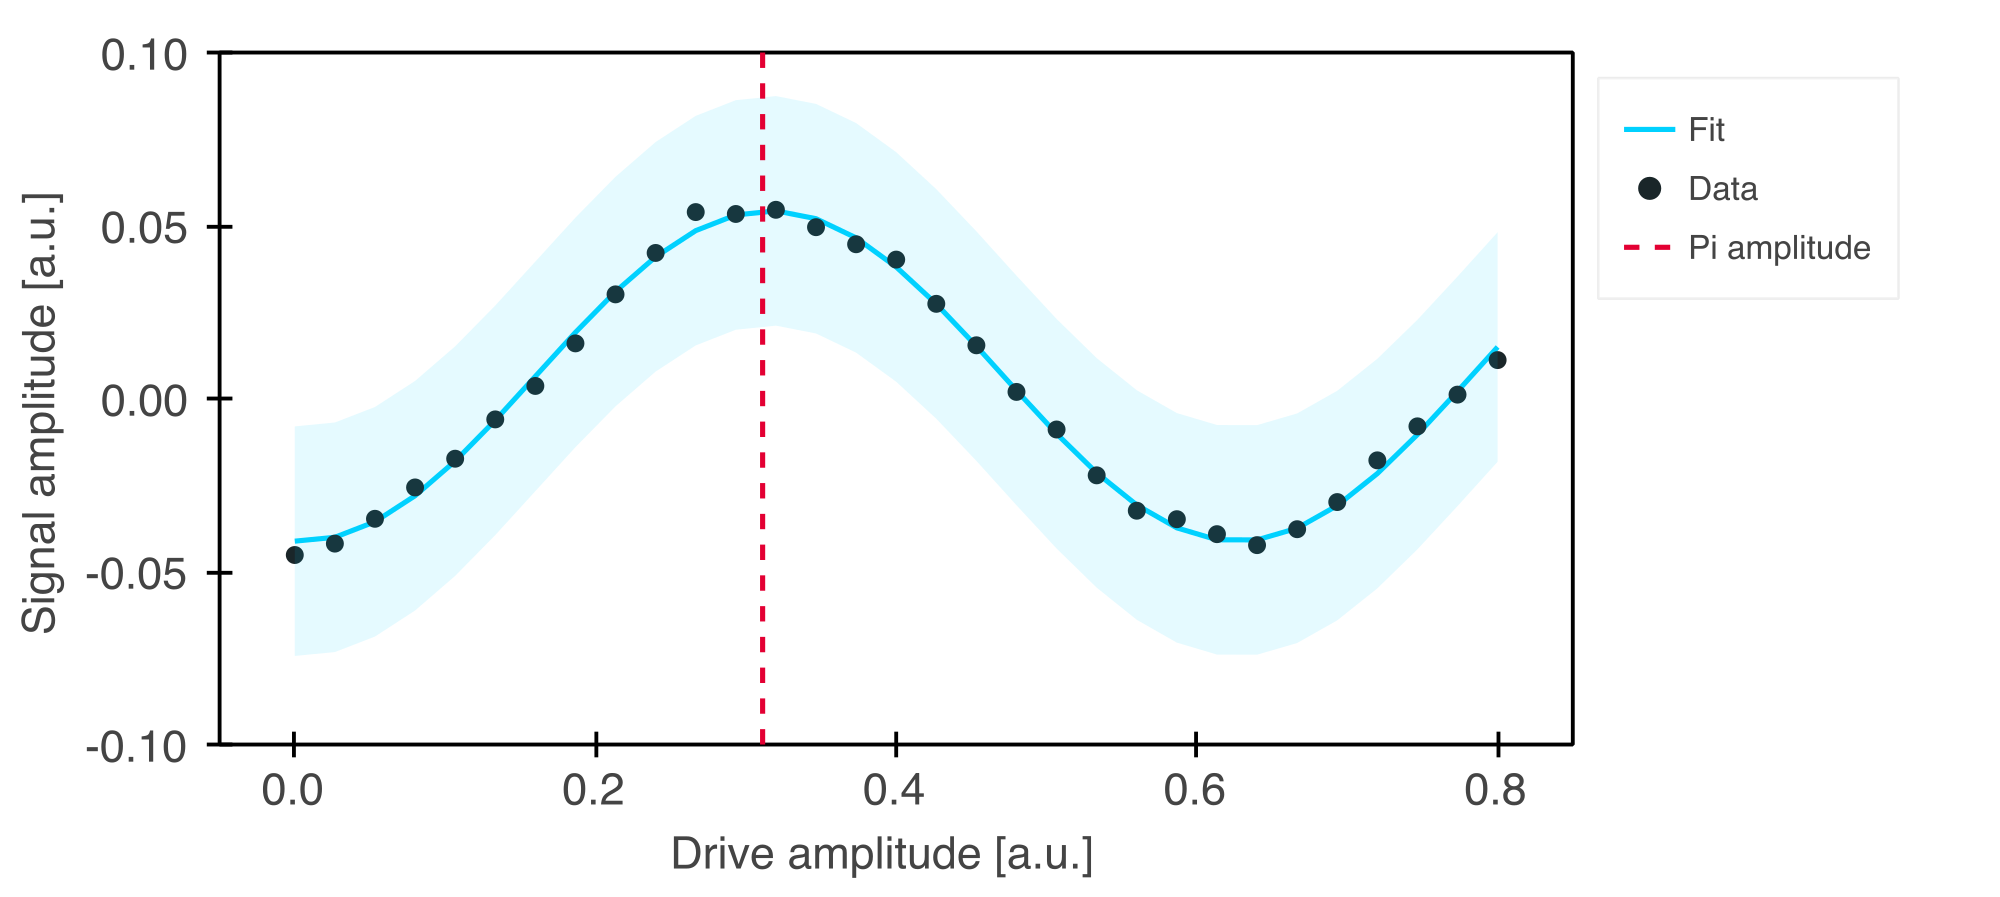
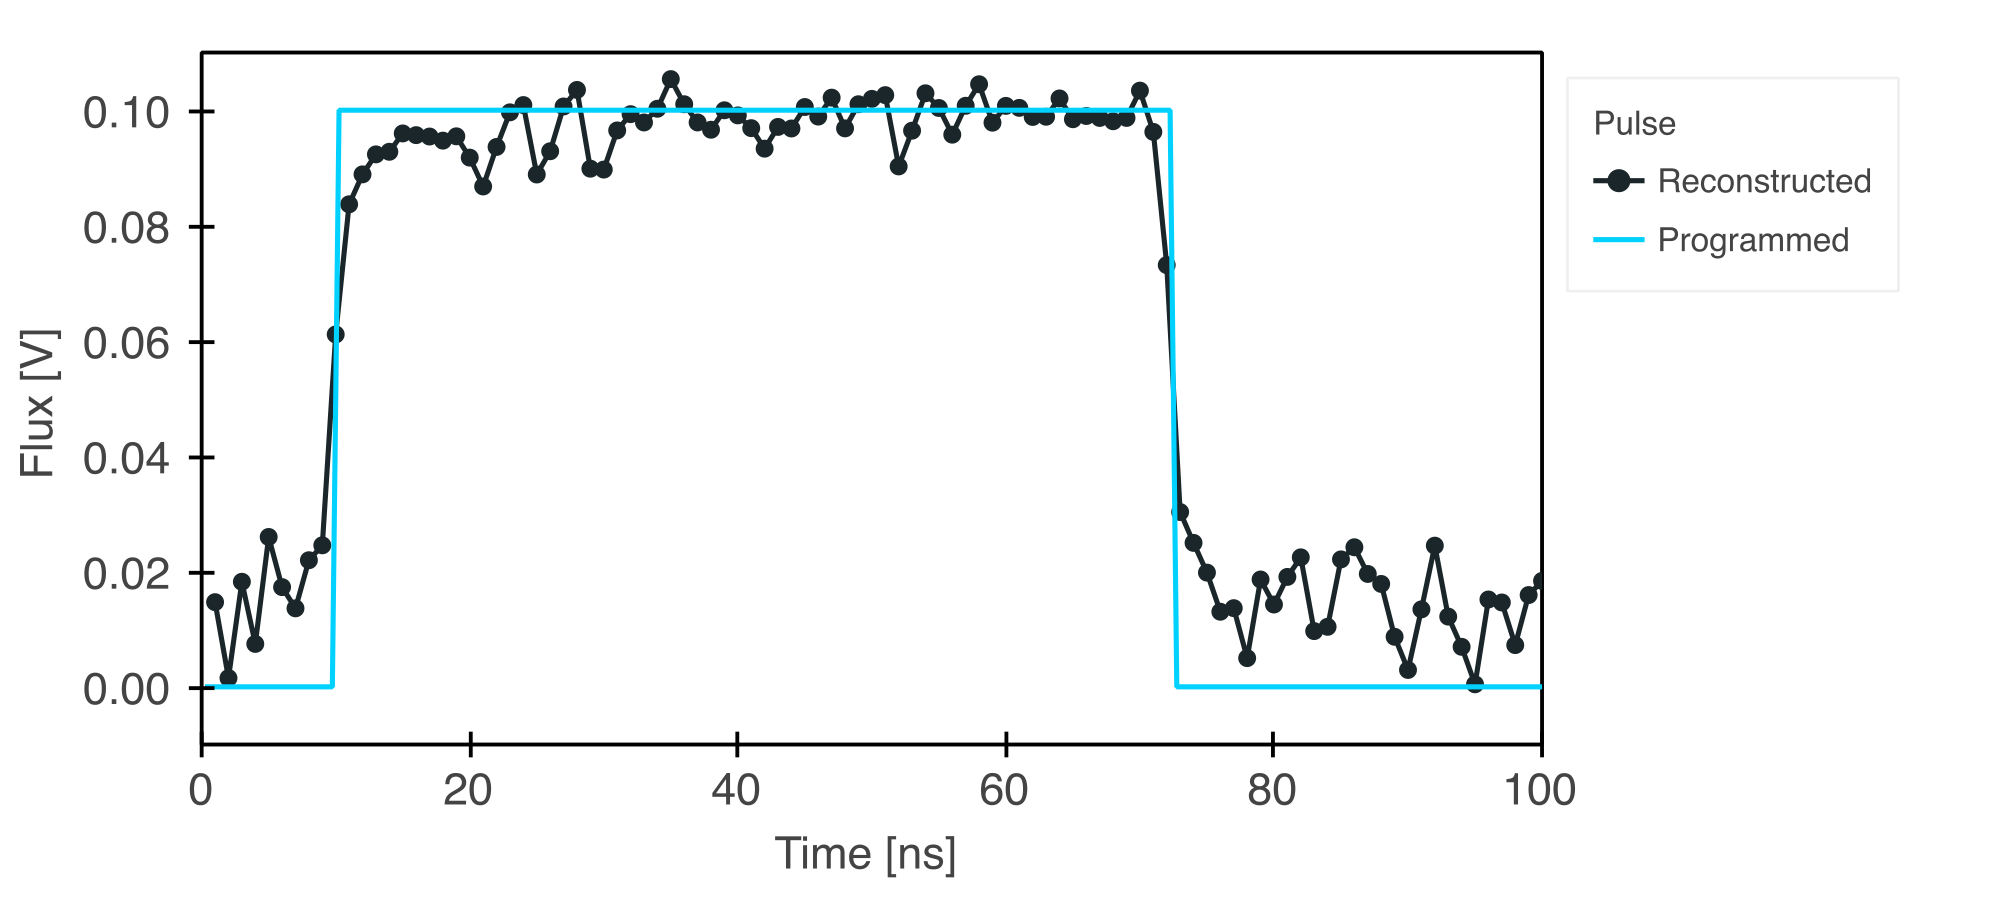
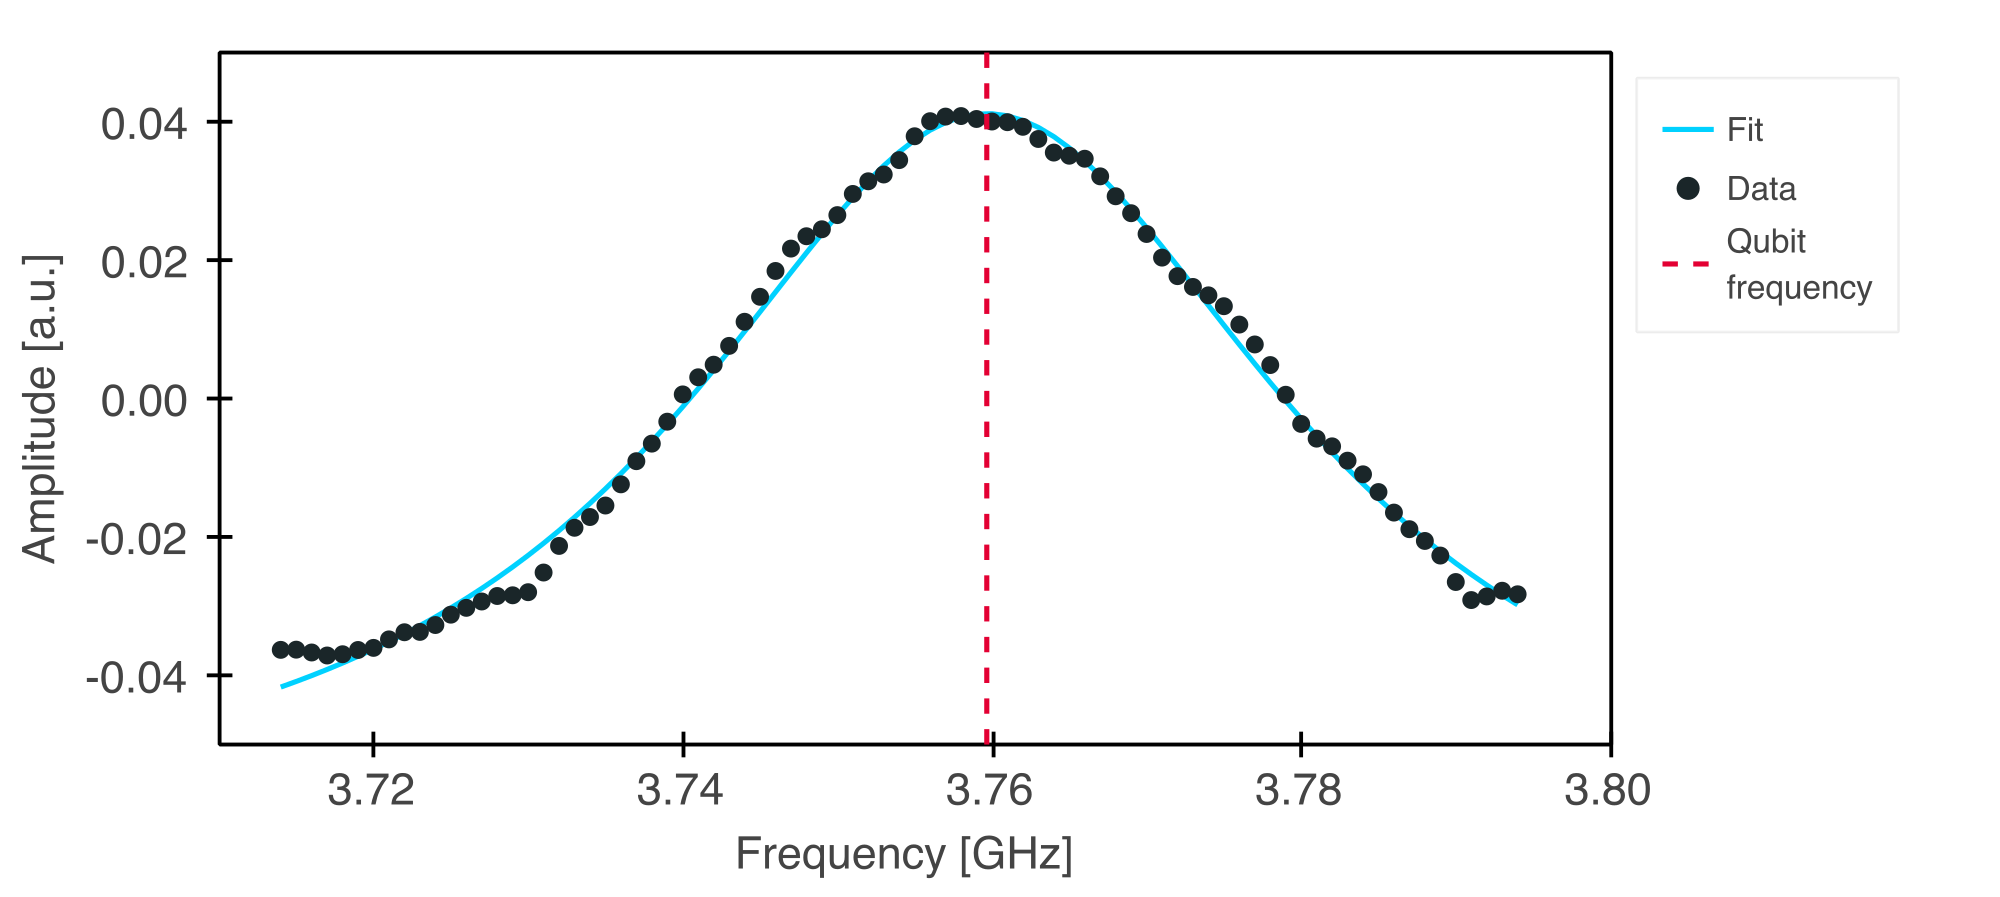
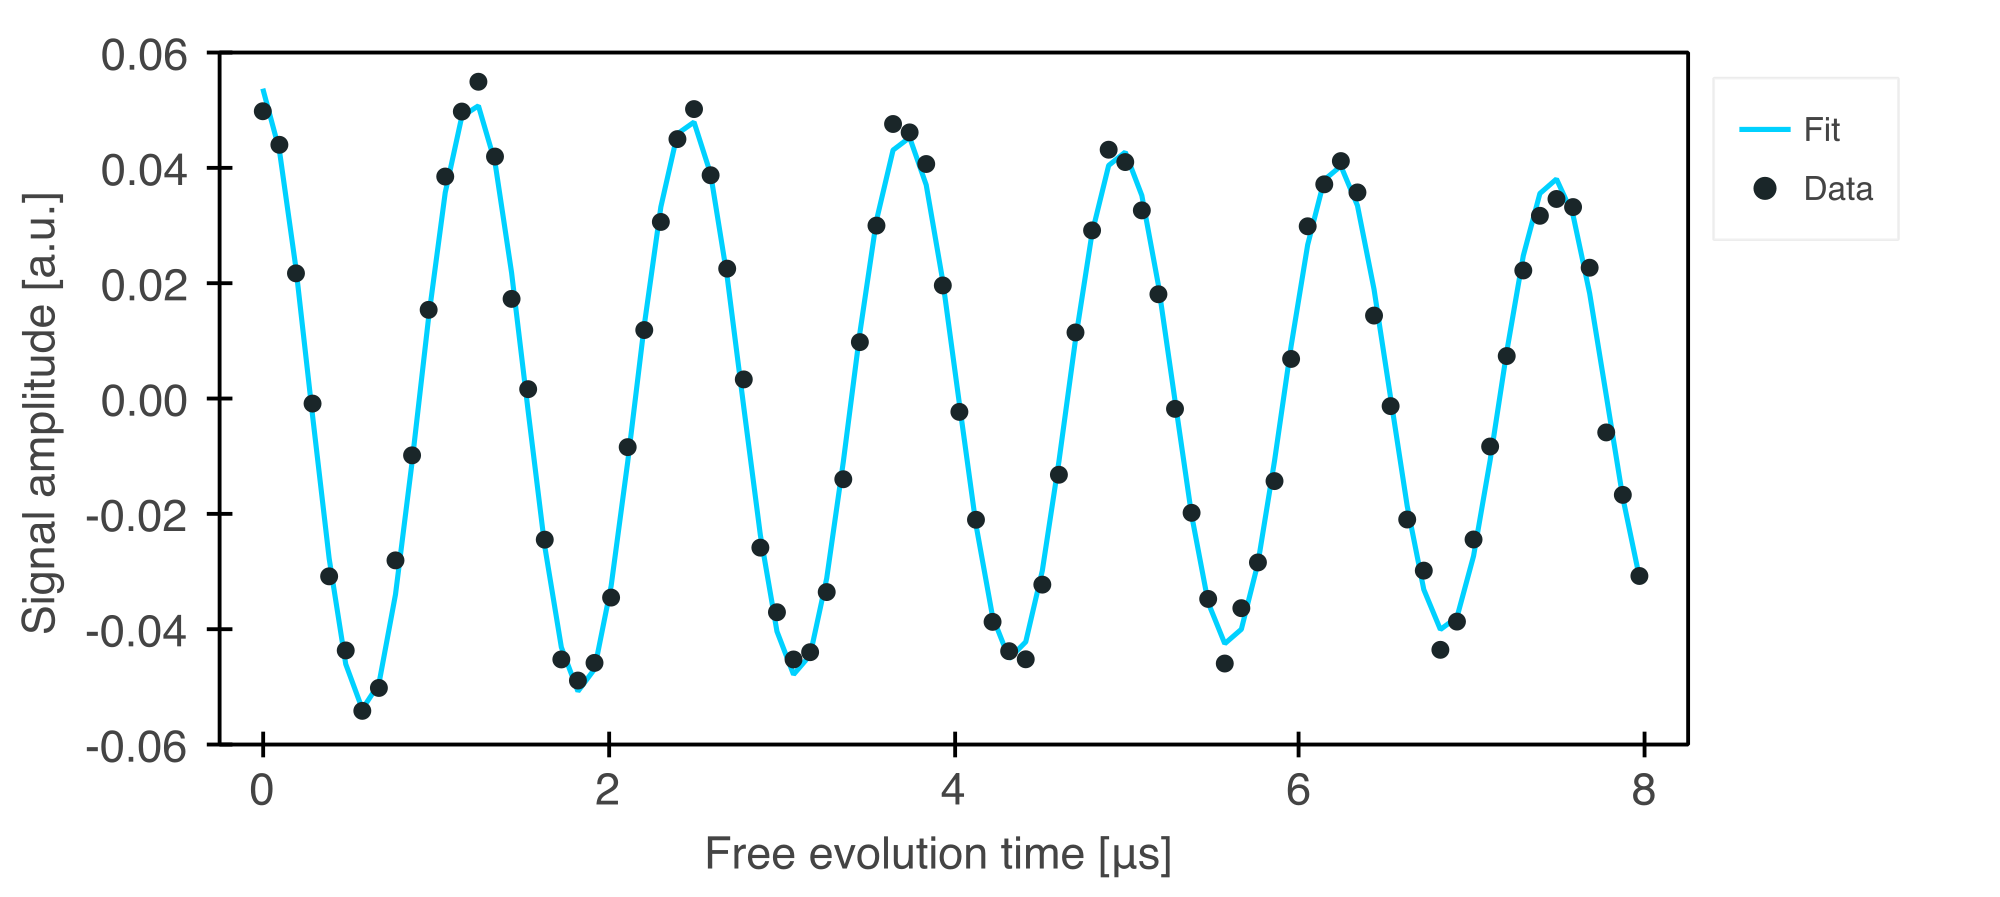
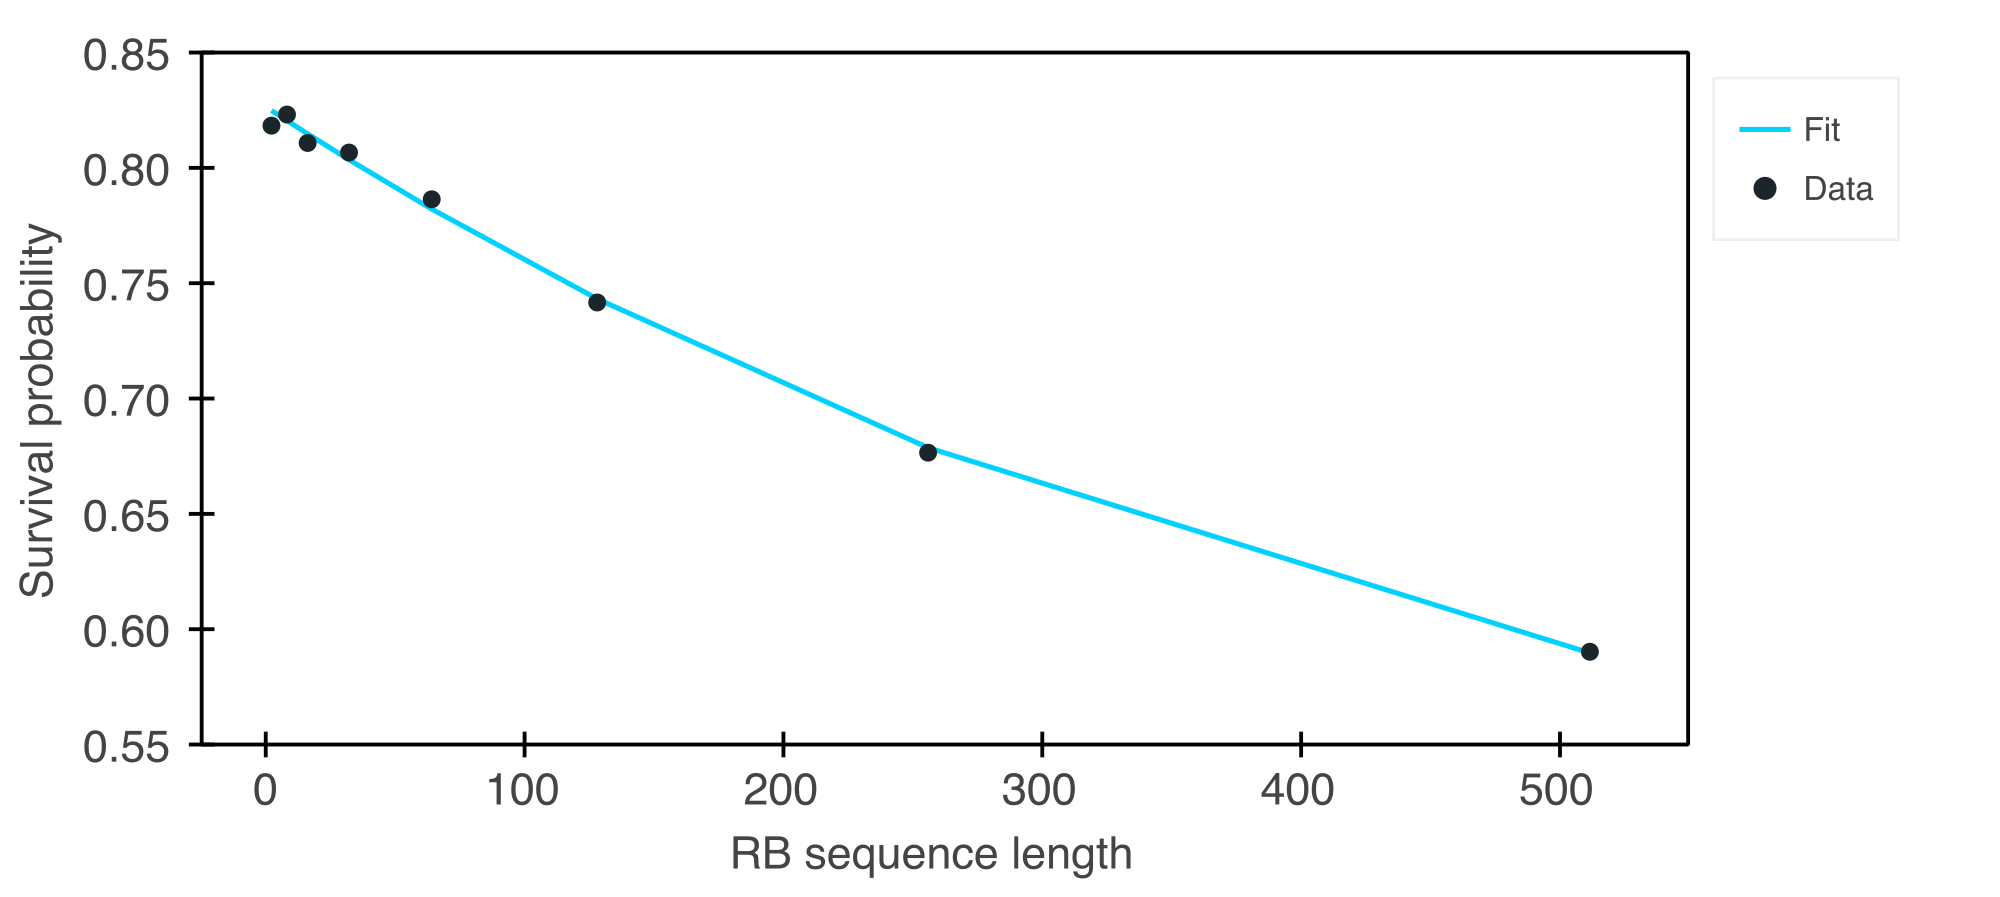
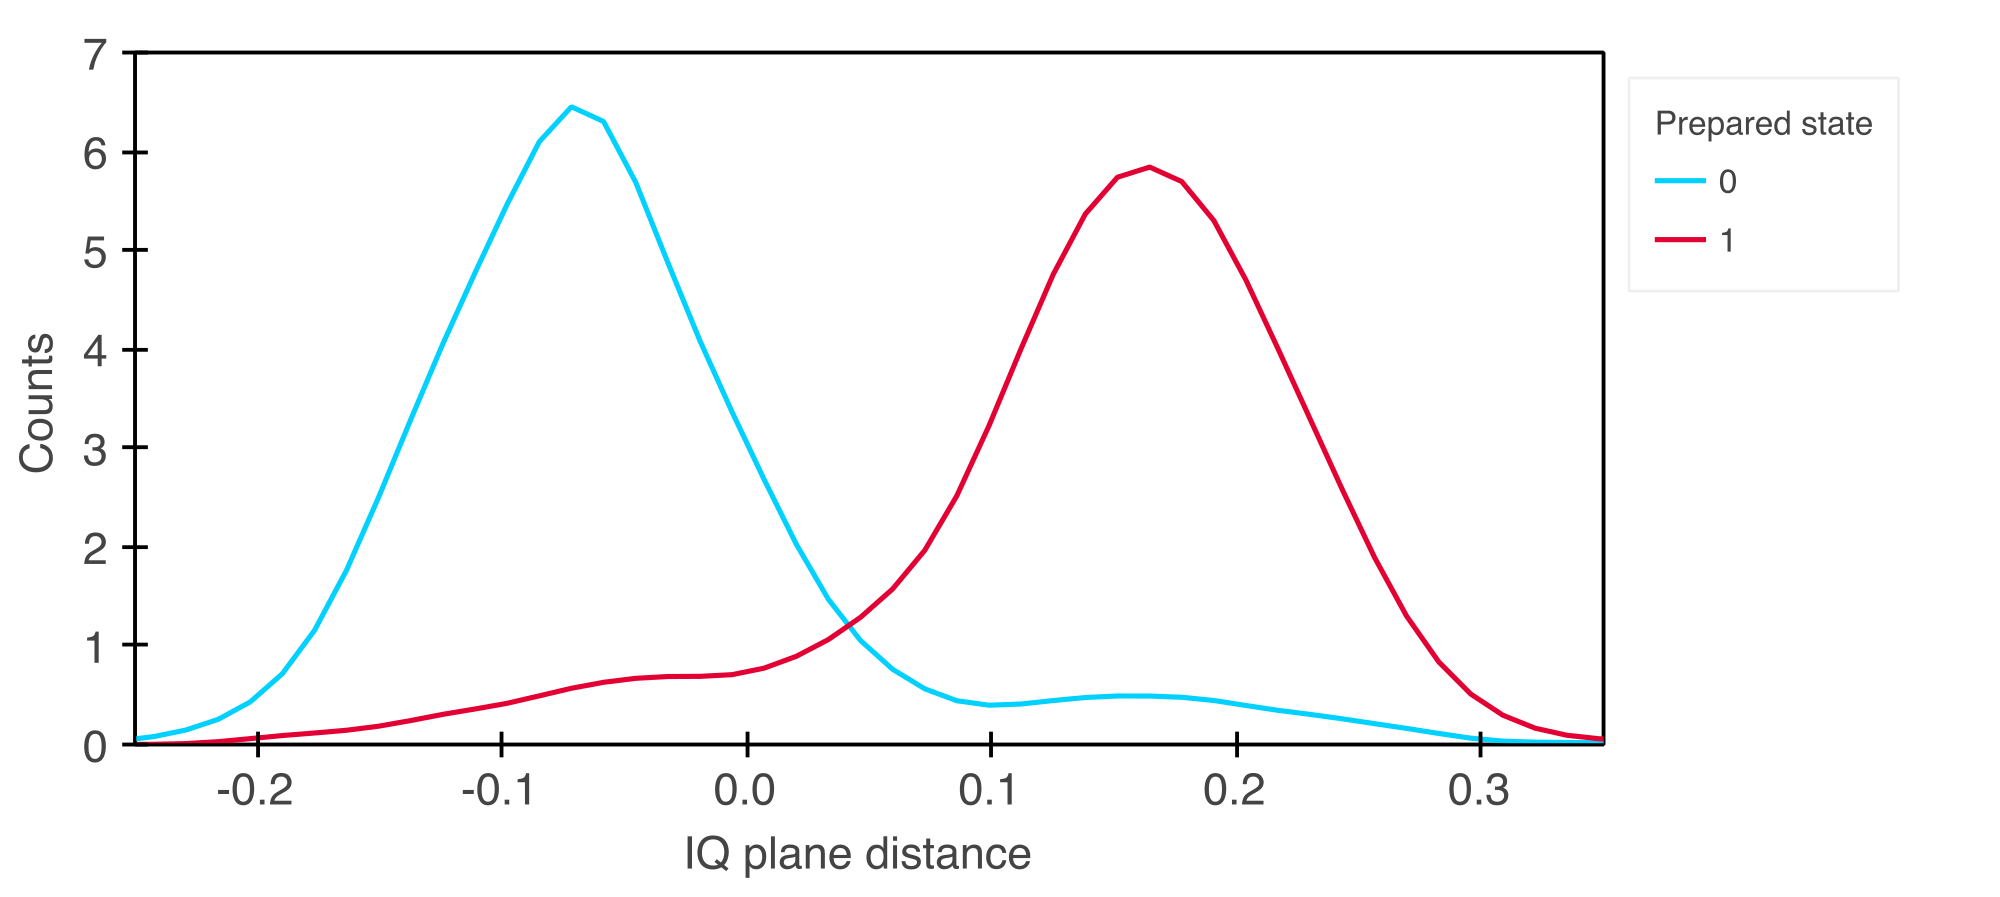
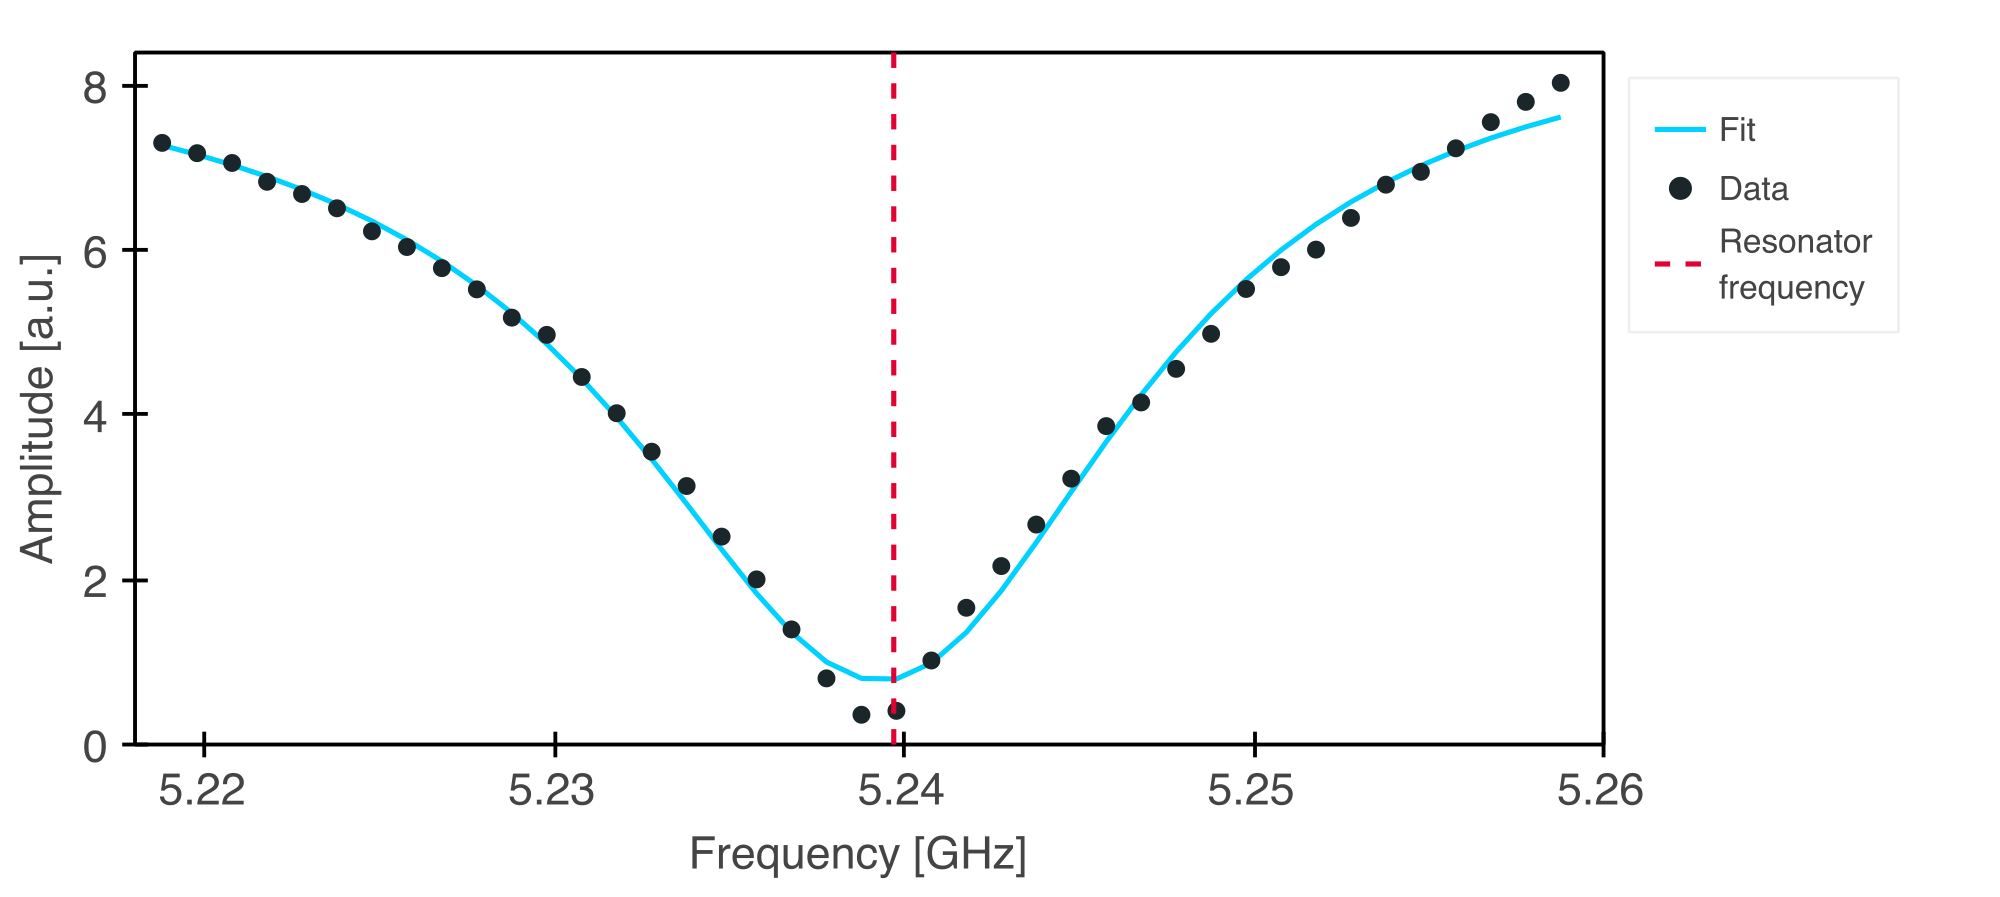
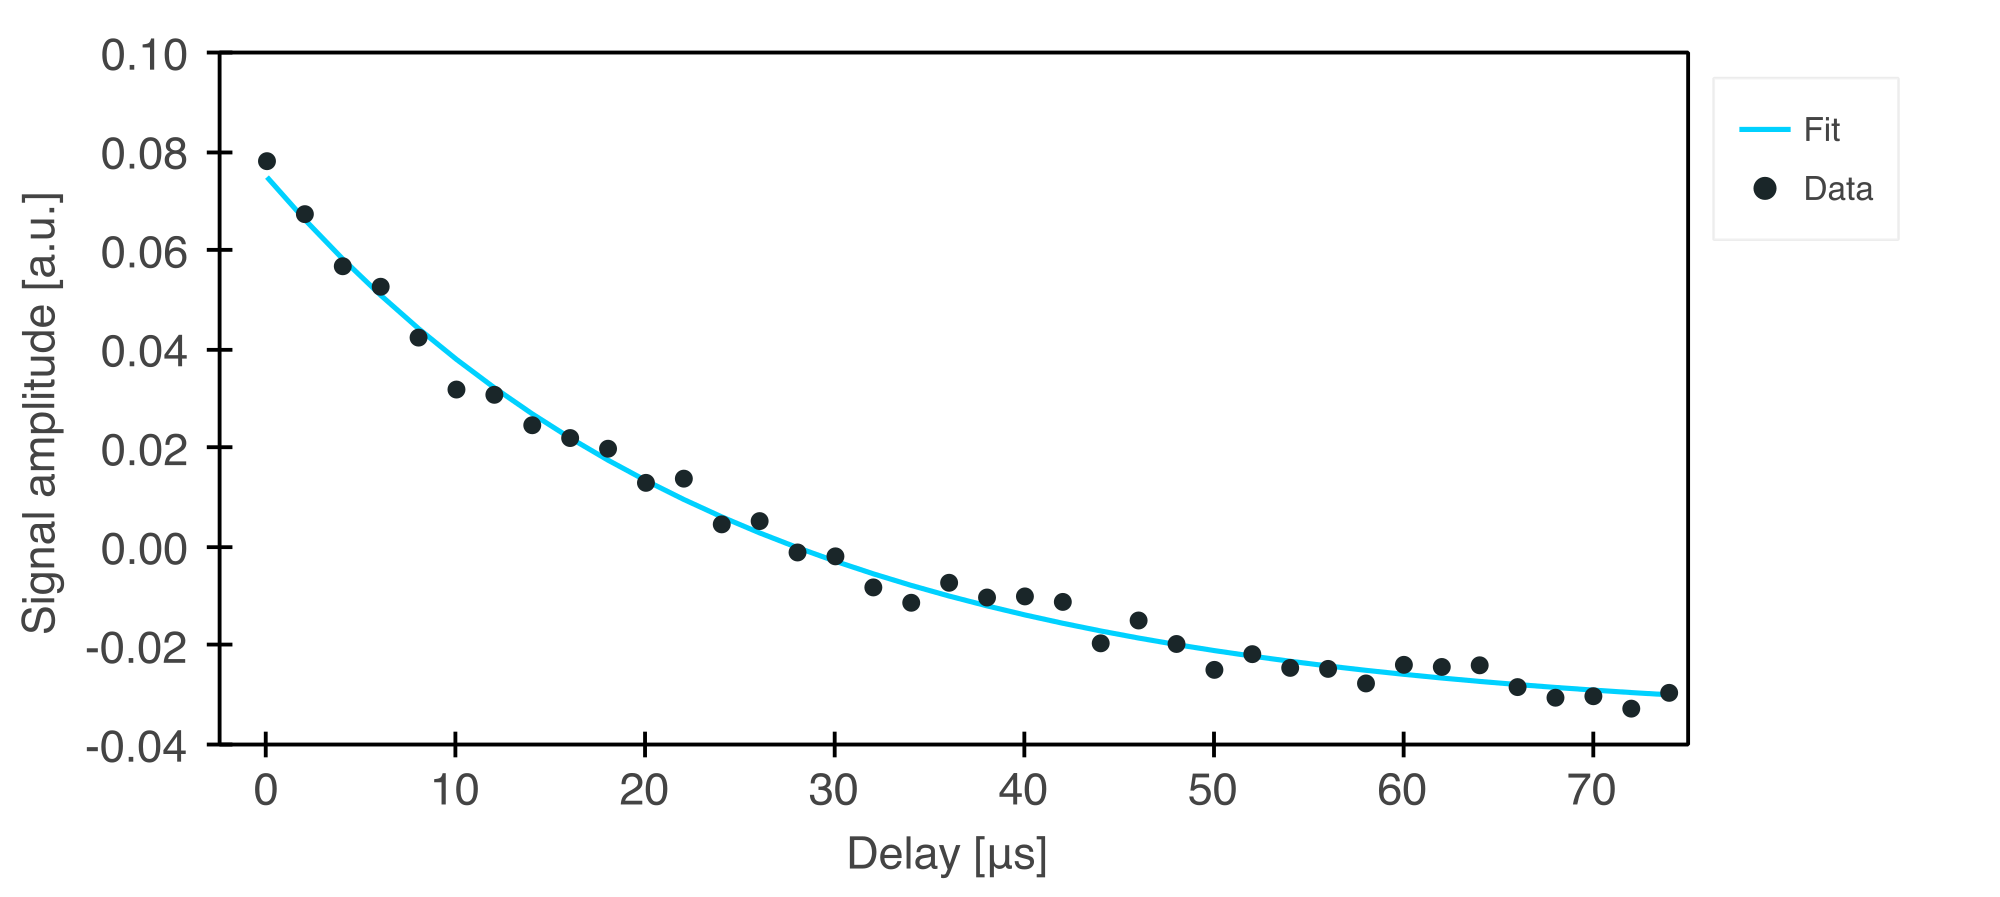
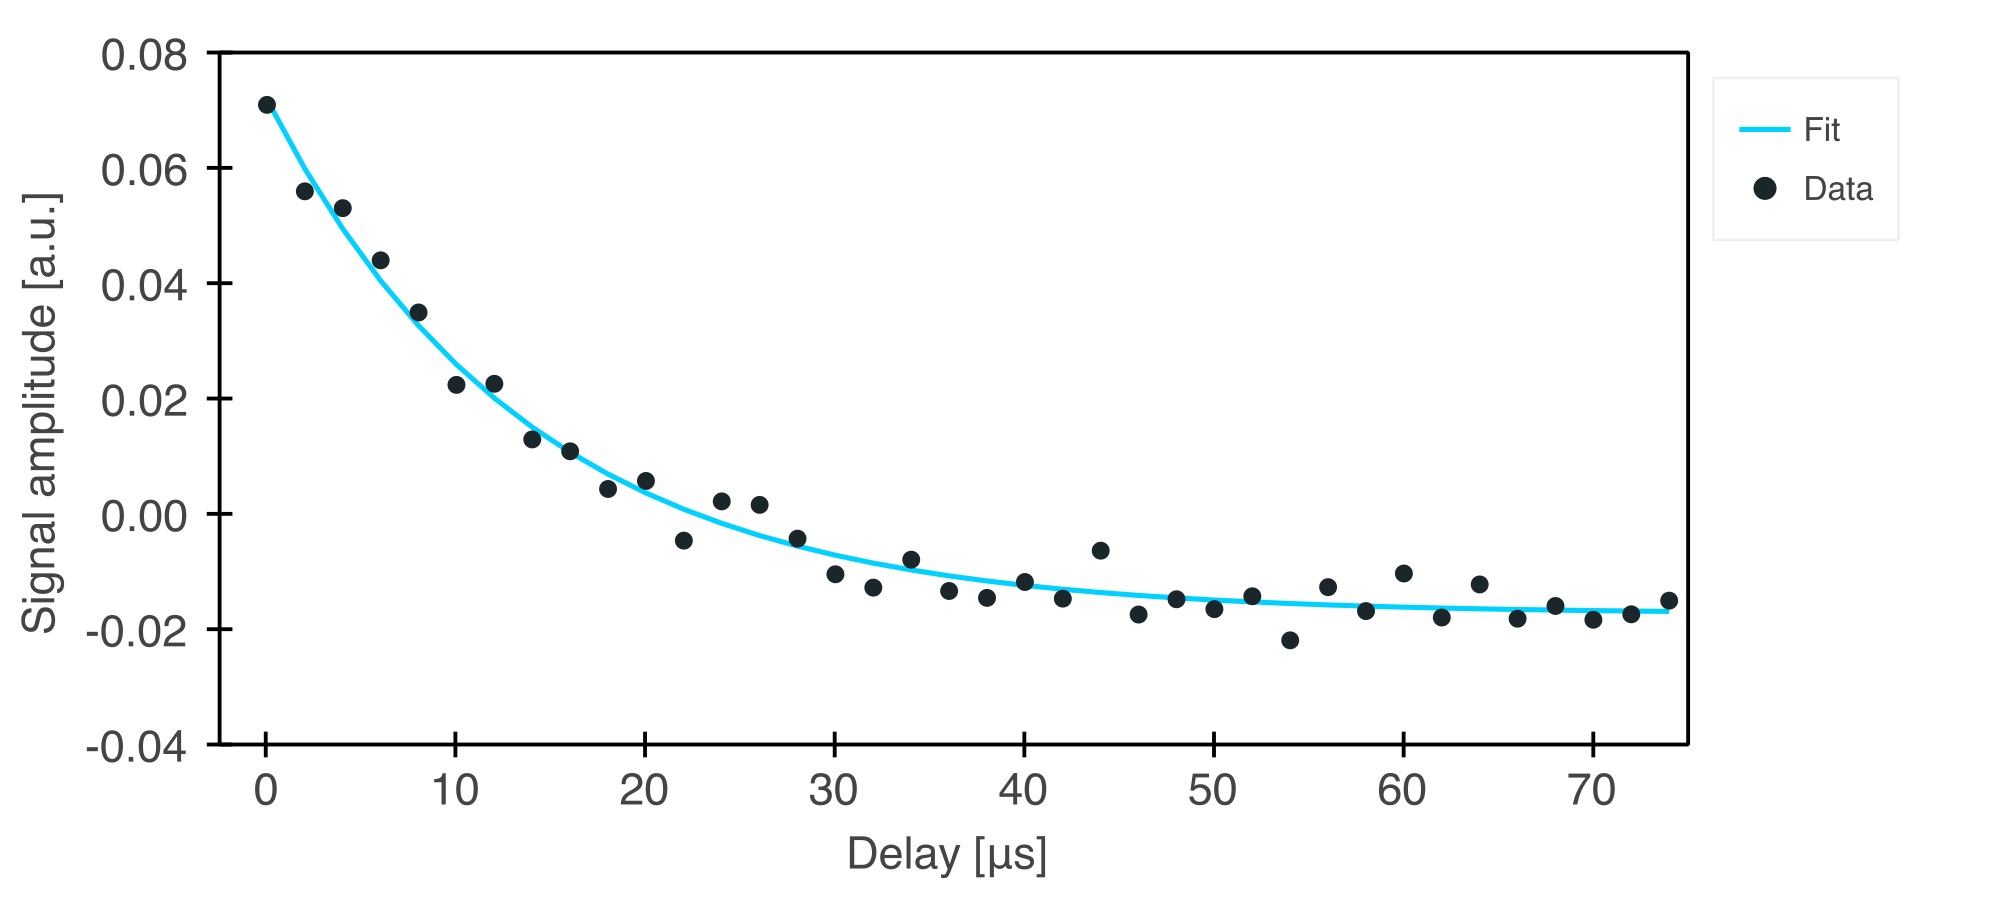
Amplitude Rabi
Amplitude Rabi
Cryoscope
Cryoscope
Pulsed Spectroscopy
Pulsed Spectroscopy
Ramsey
Ramsey
Randomised Benchmarking
Readout Discriminator Basic
Resonator Spectroscopy
T1
T1
T2 Echo
T2 Echo
Platform independent
superconducting
superconducting
rydberg-ion
Rydberg atom
trapped-ion
trapped ion
nvcentres
NV centres
spinqubits
spin qubits

Visualisation kit

QruiseOS features multiple visualisation tools to help you understand your quantum device and all your experiments.

Directly access the results of each experiment through interactive plots.
Visualise experiment data in Jupyter notebook cells with our interactive widgets.
© Qruise GmbH 2025. All rights reserved
European Union flag

Funded by the European Union. Views and opinions expressed are however those of the author(s) only and do not necessarily reflect those of the European Union or the European Innovation Council and SMEs Execitve Agency (EISMEA). Neither the European Union nor the granting authority can be held responsible for them. Grant agreement No 101099538