

Updates
August 2026July 2026June 2026April 2026March 2026February 2026January 2026December 2025November 2025October 2025August 2025July 2025May 2025January 2025August 2024June 2026 (v2026.06)
QruiseOS
This release focuses on improving both the usability of QruiseOS and the breadth of its characterisation and calibration capabilities. On the platform side, deployment has been simplified through unified service access, while dashboard navigation and data export workflows have been improved. On the experimental side, we've introduced new characterisation and calibration capabilities, improved hardware-control workflows, and expanded the tooling available for experiment analysis and device bring-up.
Software & platform
Single-URL access to all services
All QruiseOS services — the dashboard, JupyterHub, IAM, and queue monitoring — are now reachable through a single URL (https://<YOUR-HOST-NAME>) and port using path-based routing for local deployments (e.g. localhost:8088). Previously, each service required a separately exposed port or URL. This removes a common source of network configuration friction, especially for offline or on-premises deployments, and makes the system easier to operate and share across a team.
For example, JupyterLab can be accessed through https://<YOUR-HOST>/jupyter/ for a shared deployment or http://localhost:8088/jupyter/ when running locally.
Bulk experiment export
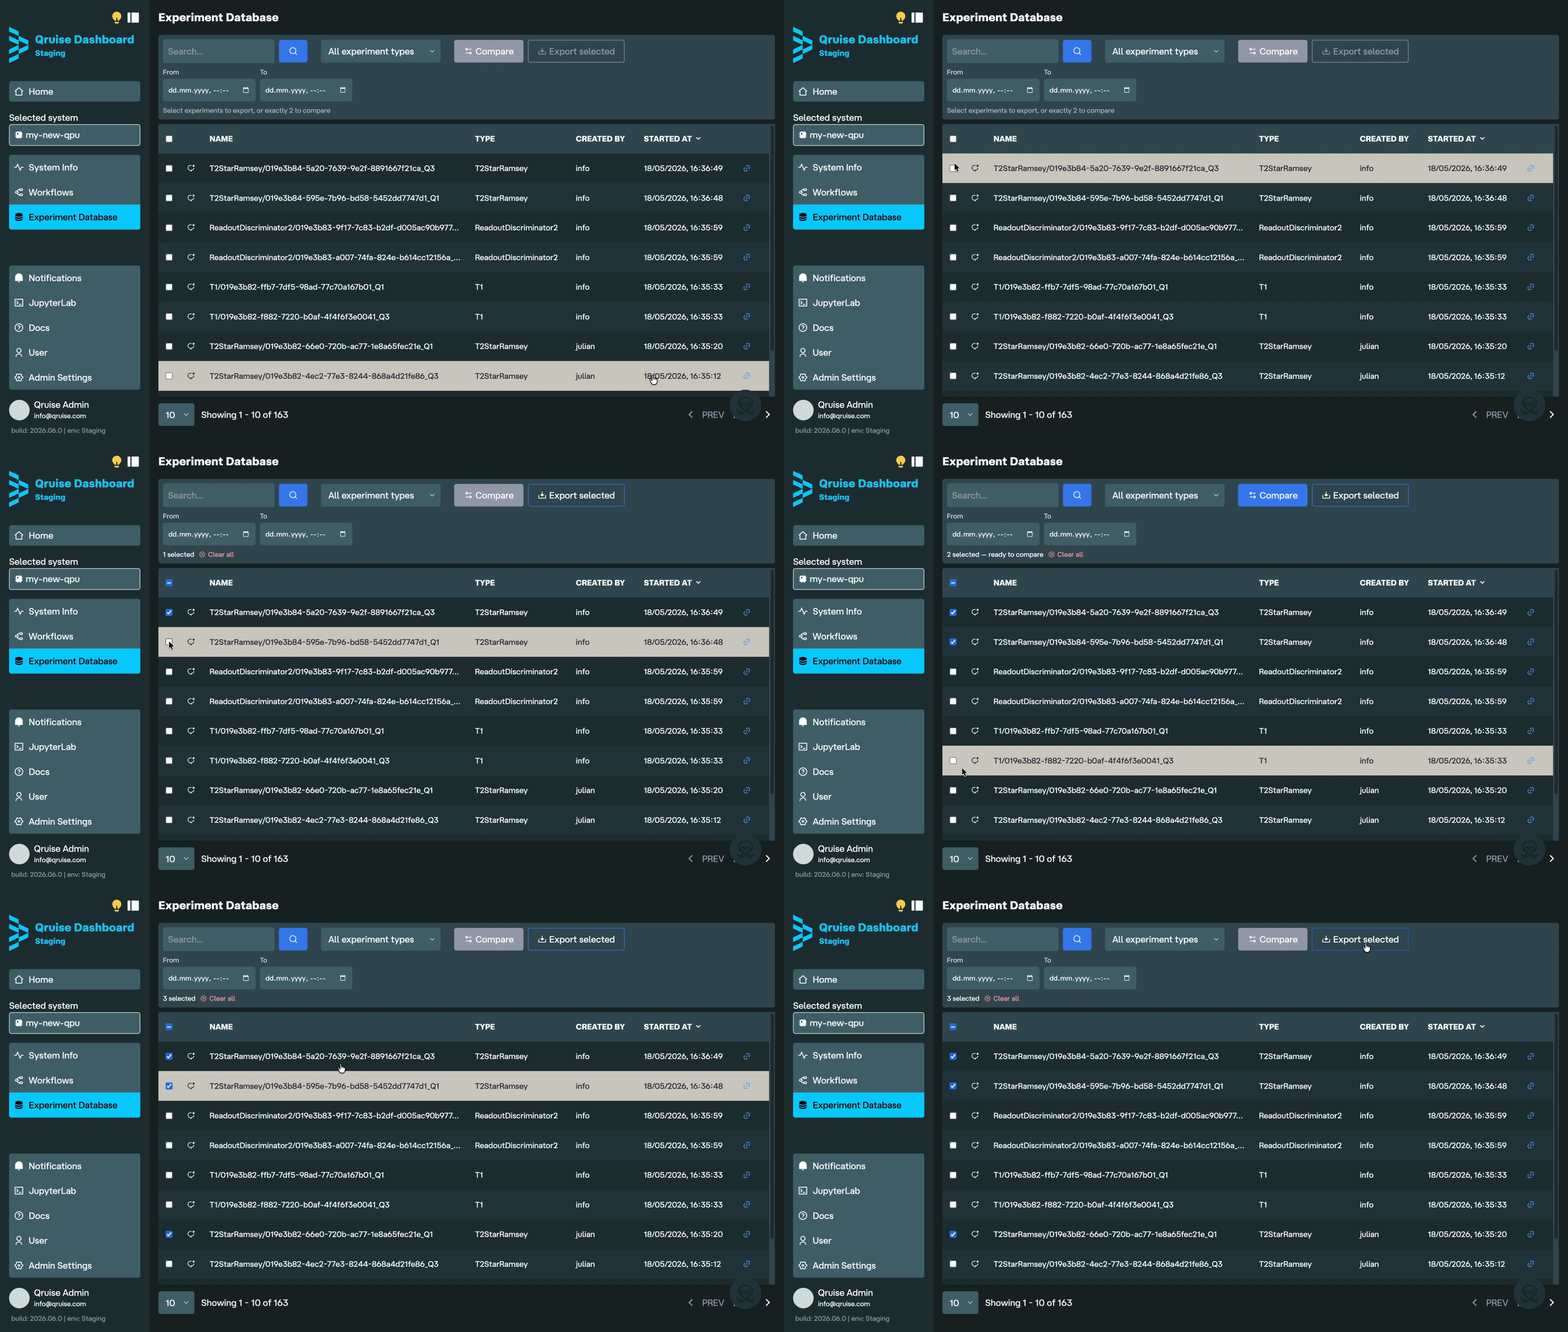
Experiments can now be exported in bulk directly from the dashboard. Select any combination of experiments in the overview and download them all at once as a zip archive, with one folder per experiment. You can also export all experiments from an entire workflow run in one click.
Time-range filters for experiments
The Experiment Database now has "From" and "To" date and time filters, making it easy to find experiments run during a specific time period. This is useful when working with large experiment histories across multiple sessions.
System Info page redesign
The System Info page has been redesigned. QPU parameters now display with human-readable names (e.g. Qubit 1 instead of q1) and SI-prefixed units (e.g. qubit frequencies in GHz and T1 time in µs). Display names and units are read from the display field defined on each quantity in your knowledge base schema; a built-in registry of common metric paths (covering coherence times, gate parameters, and readout properties) serves as a fallback for quantities without a custom display definition. For parameters derived from experimental results, the source experiment ID and timestamp are also shown. Branch selection is now integrated directly into the page.
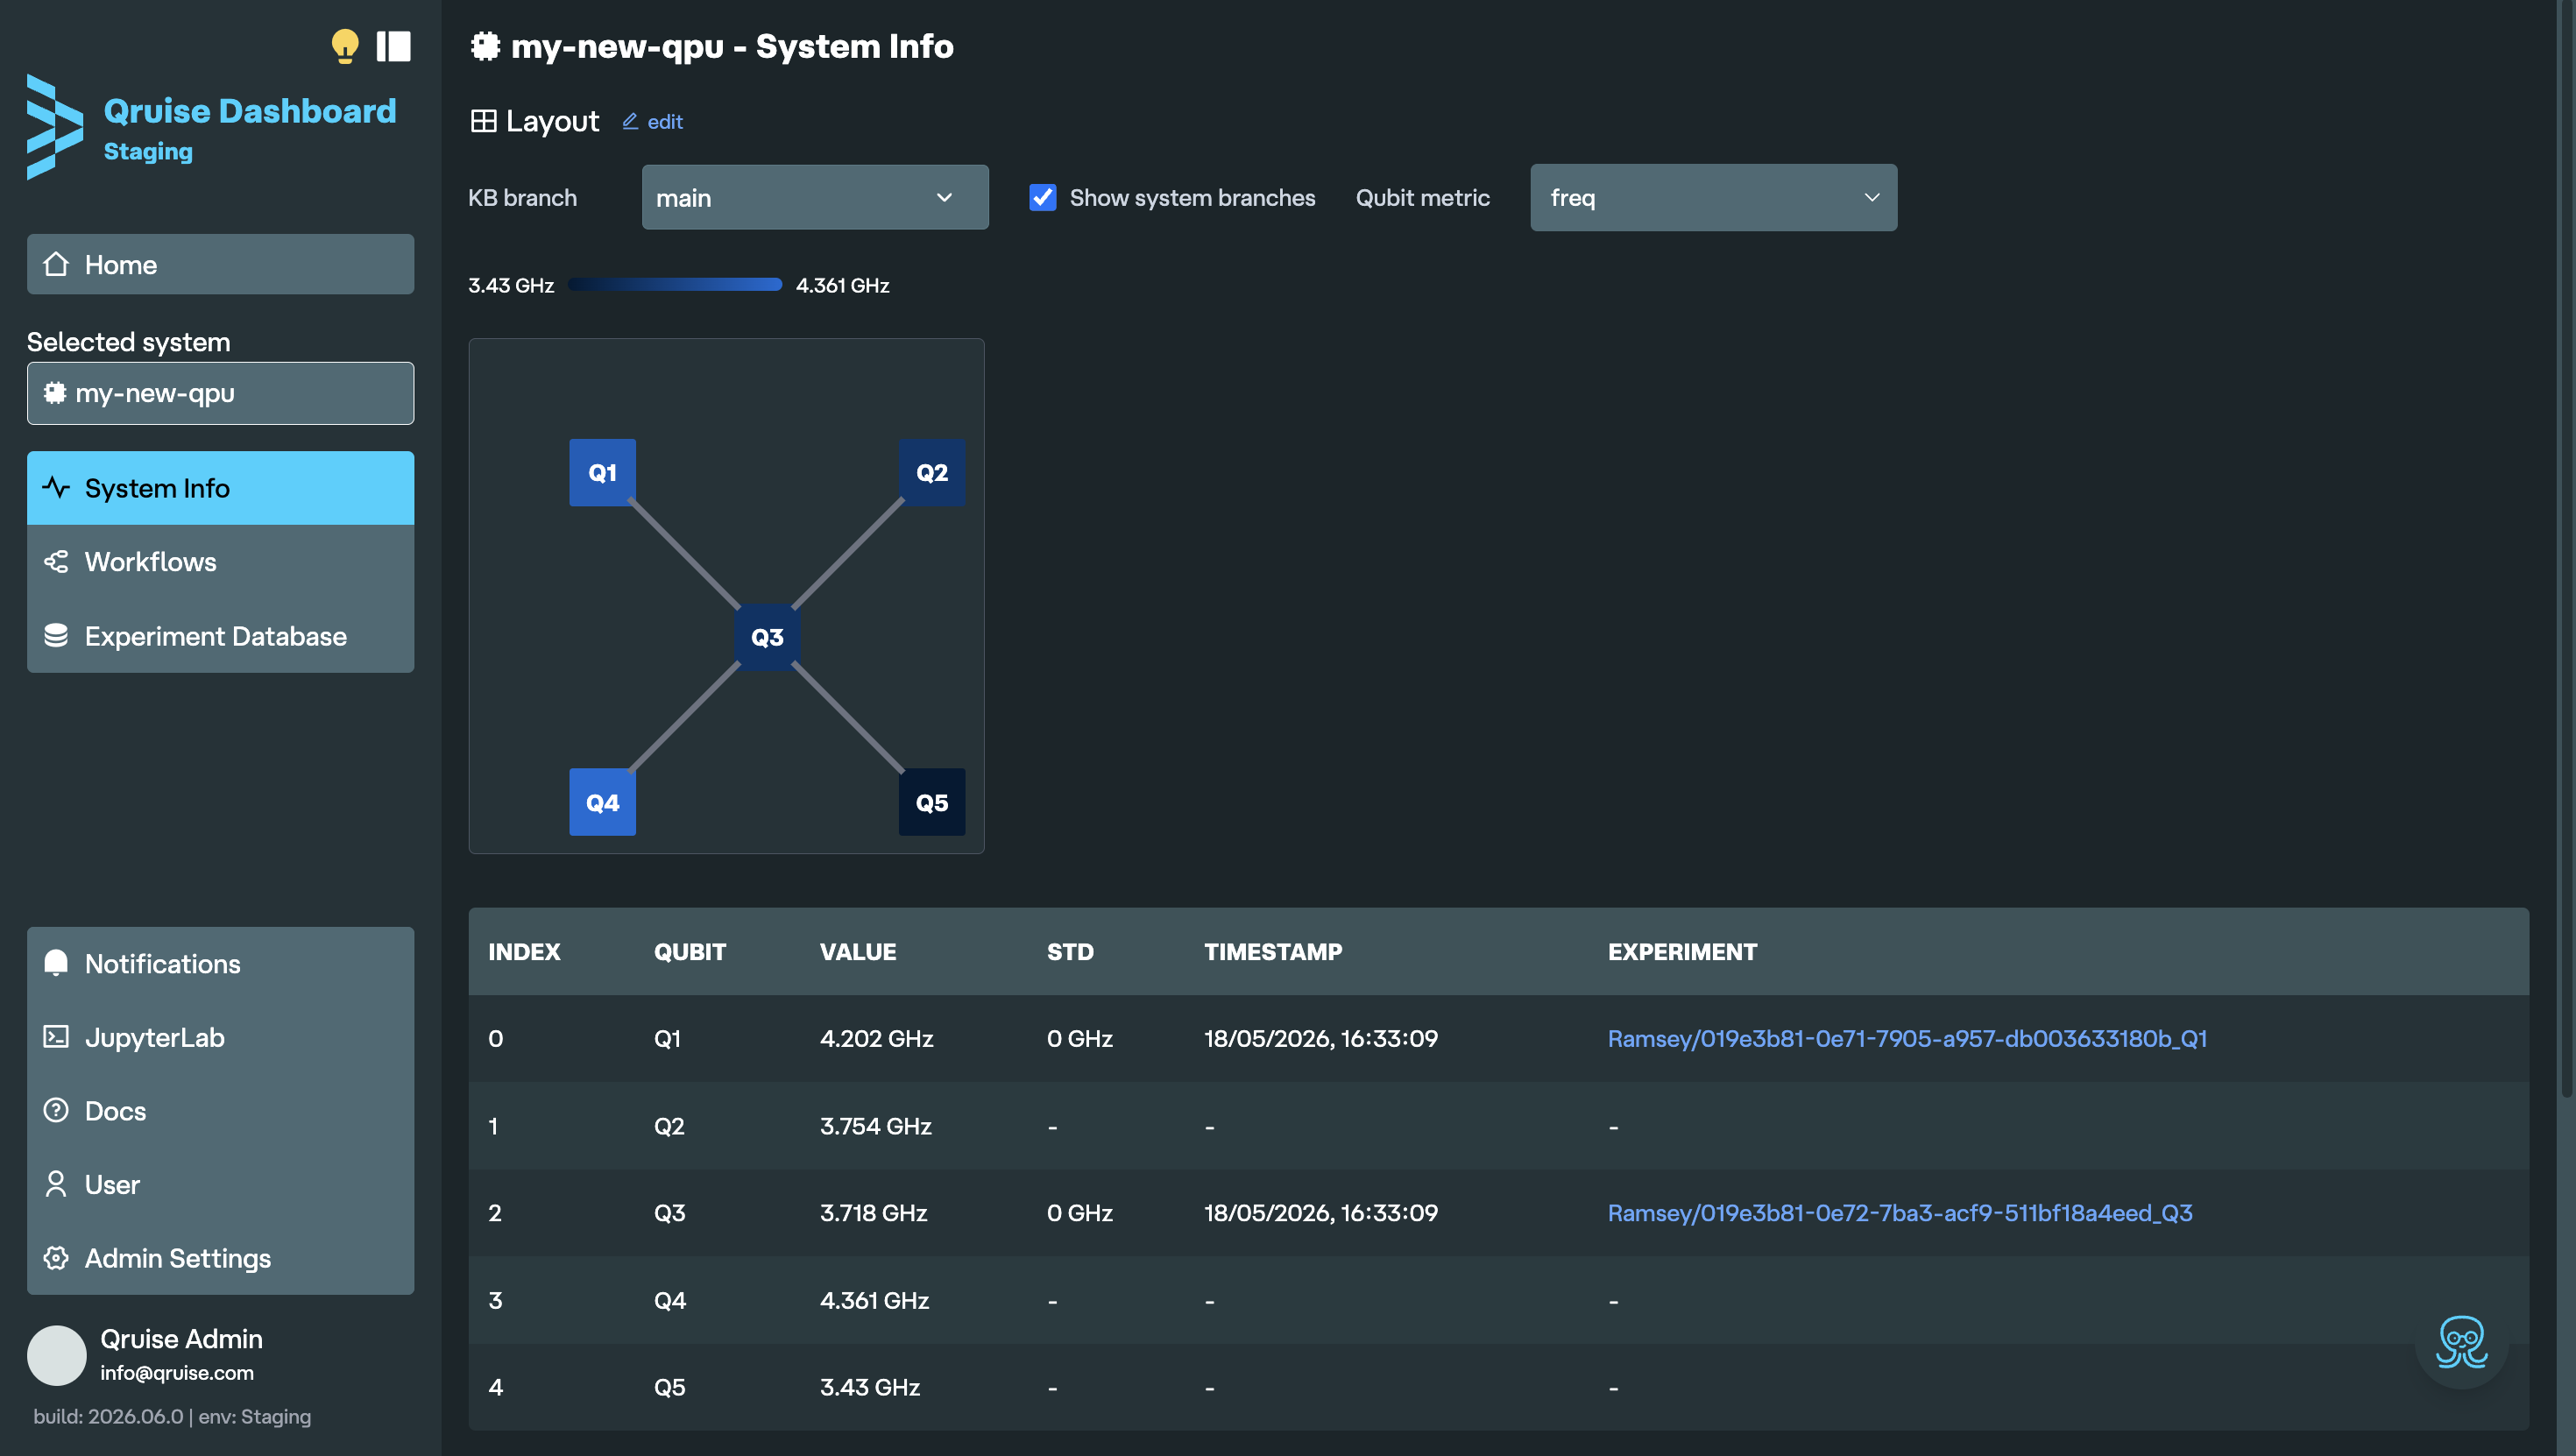
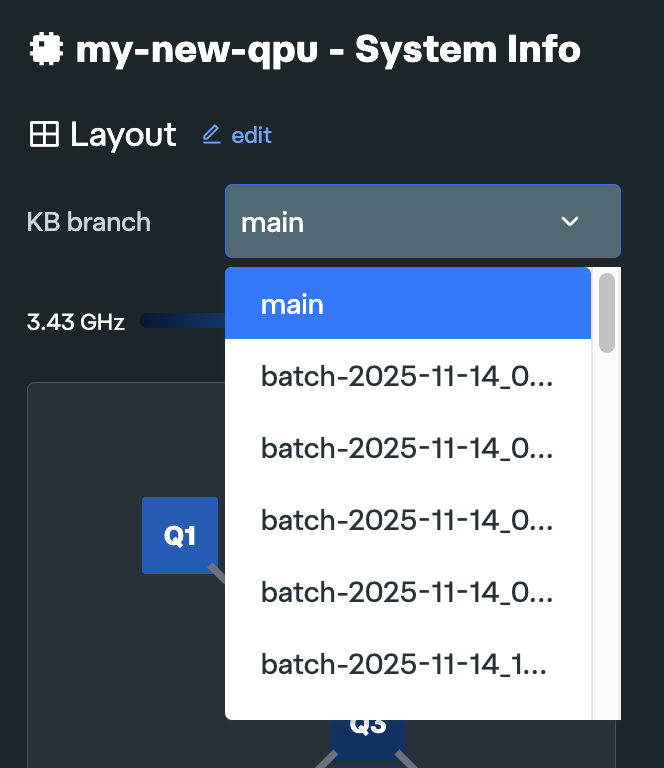
The branch selector is now a searchable dropdown instead of a plain list. System branches are hidden by default with a toggle to show them. Your selected qubit metric is remembered across branch switches.
Faster experiment & measurement list loading
Experiment and measurement lists now load significantly faster, especially when working with large datasets. Detailed run information is loaded only when needed, improving responsiveness throughout the dashboard.
Improved AI assistant integration
OpenCode and other AI assistants can now access the QruiseOS knowledge base through GraphQL, enabling more precise retrieval of experiment and calibration data.
Experiments & calibration
Flux crosstalk calibration workflow
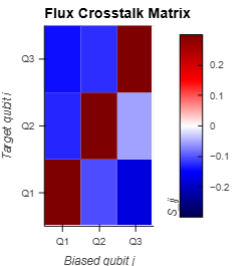
A full flux crosstalk calibration workflow is now available, covering spectroscopy, characterisation, and parameter tagging.
Dispersive shift measurement
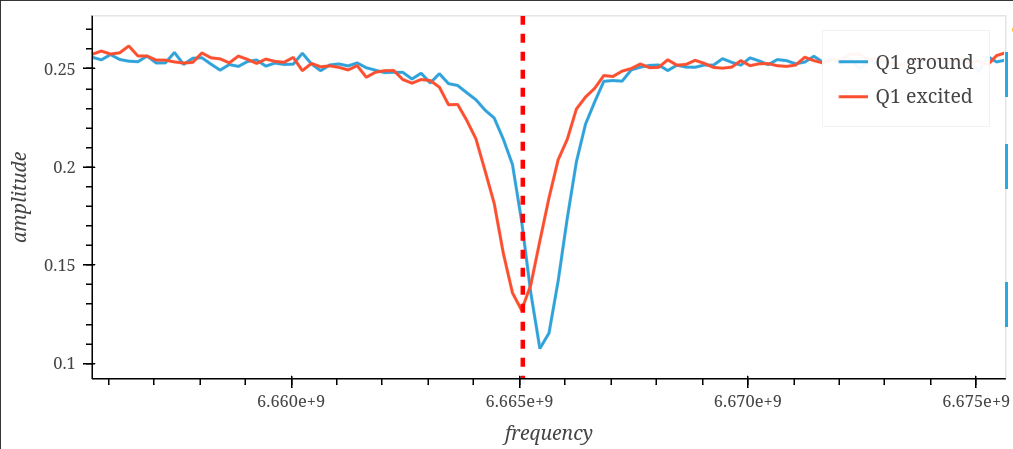
For resonator-based qubit readout, the dispersive shift () is measured via the resonator spectroscopy experiment by measuring the resonator frequency with the qubit in the ground and excited states. This is useful for setting up readout pulse parameters and verifying qubit–resonator coupling.
Readout contrast sweeps over power and amplitude
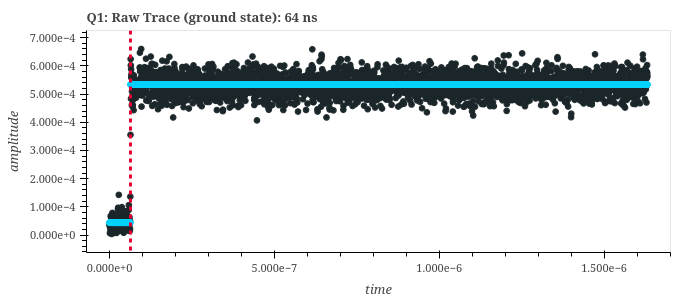
A new readout contrast experiment sweeps over readout power and amplitude and determines the optimal integration time. This makes it faster to find optimal readout operating points without running separate single-parameter sweeps.
Time-of-flight & transmission-line notebooks
Characterisation notebooks for time-of-flight and transmission-line measurements are now included, covering signal delay and cable attenuation characterisation for initial system bring-up.
Qiskit integration: calibrated gate properties
QPU calibration data is now persisted and served to Qiskit clients. This means Qiskit circuits can use hardware-native basis gates informed by live calibration results, rather than relying on generic defaults. The integration covers gate definitions, readout parameters, and qubit properties, and is kept in sync as calibration flows run.
Table of contents
QruiseOSSoftware & platformSingle-URL access to all servicesBulk experiment exportTime-range filters for experimentsSystem Info page redesignFaster experiment & measurement list loadingImproved AI assistant integrationExperiments & calibrationFlux crosstalk calibration workflowDispersive shift measurementReadout contrast sweeps over power and amplitudeTime-of-flight & transmission-line notebooksQiskit integration: calibrated gate propertiesStay informed with our newsletter
Subscribe to our newsletter to get the latest updates on our products and services.