

Updates
August 2026July 2026June 2026April 2026March 2026February 2026January 2026December 2025November 2025October 2025August 2025July 2025May 2025January 2025August 2024July 2026 (v2026.07)
QruiseML
This release marks the launch of v3 of our simulation and modelling library, qruise-toolset. Designed from the ground up, this version uses a high-performance and memory-efficient Julia-based simulation engine while retaining the familiar user-facing Python API.
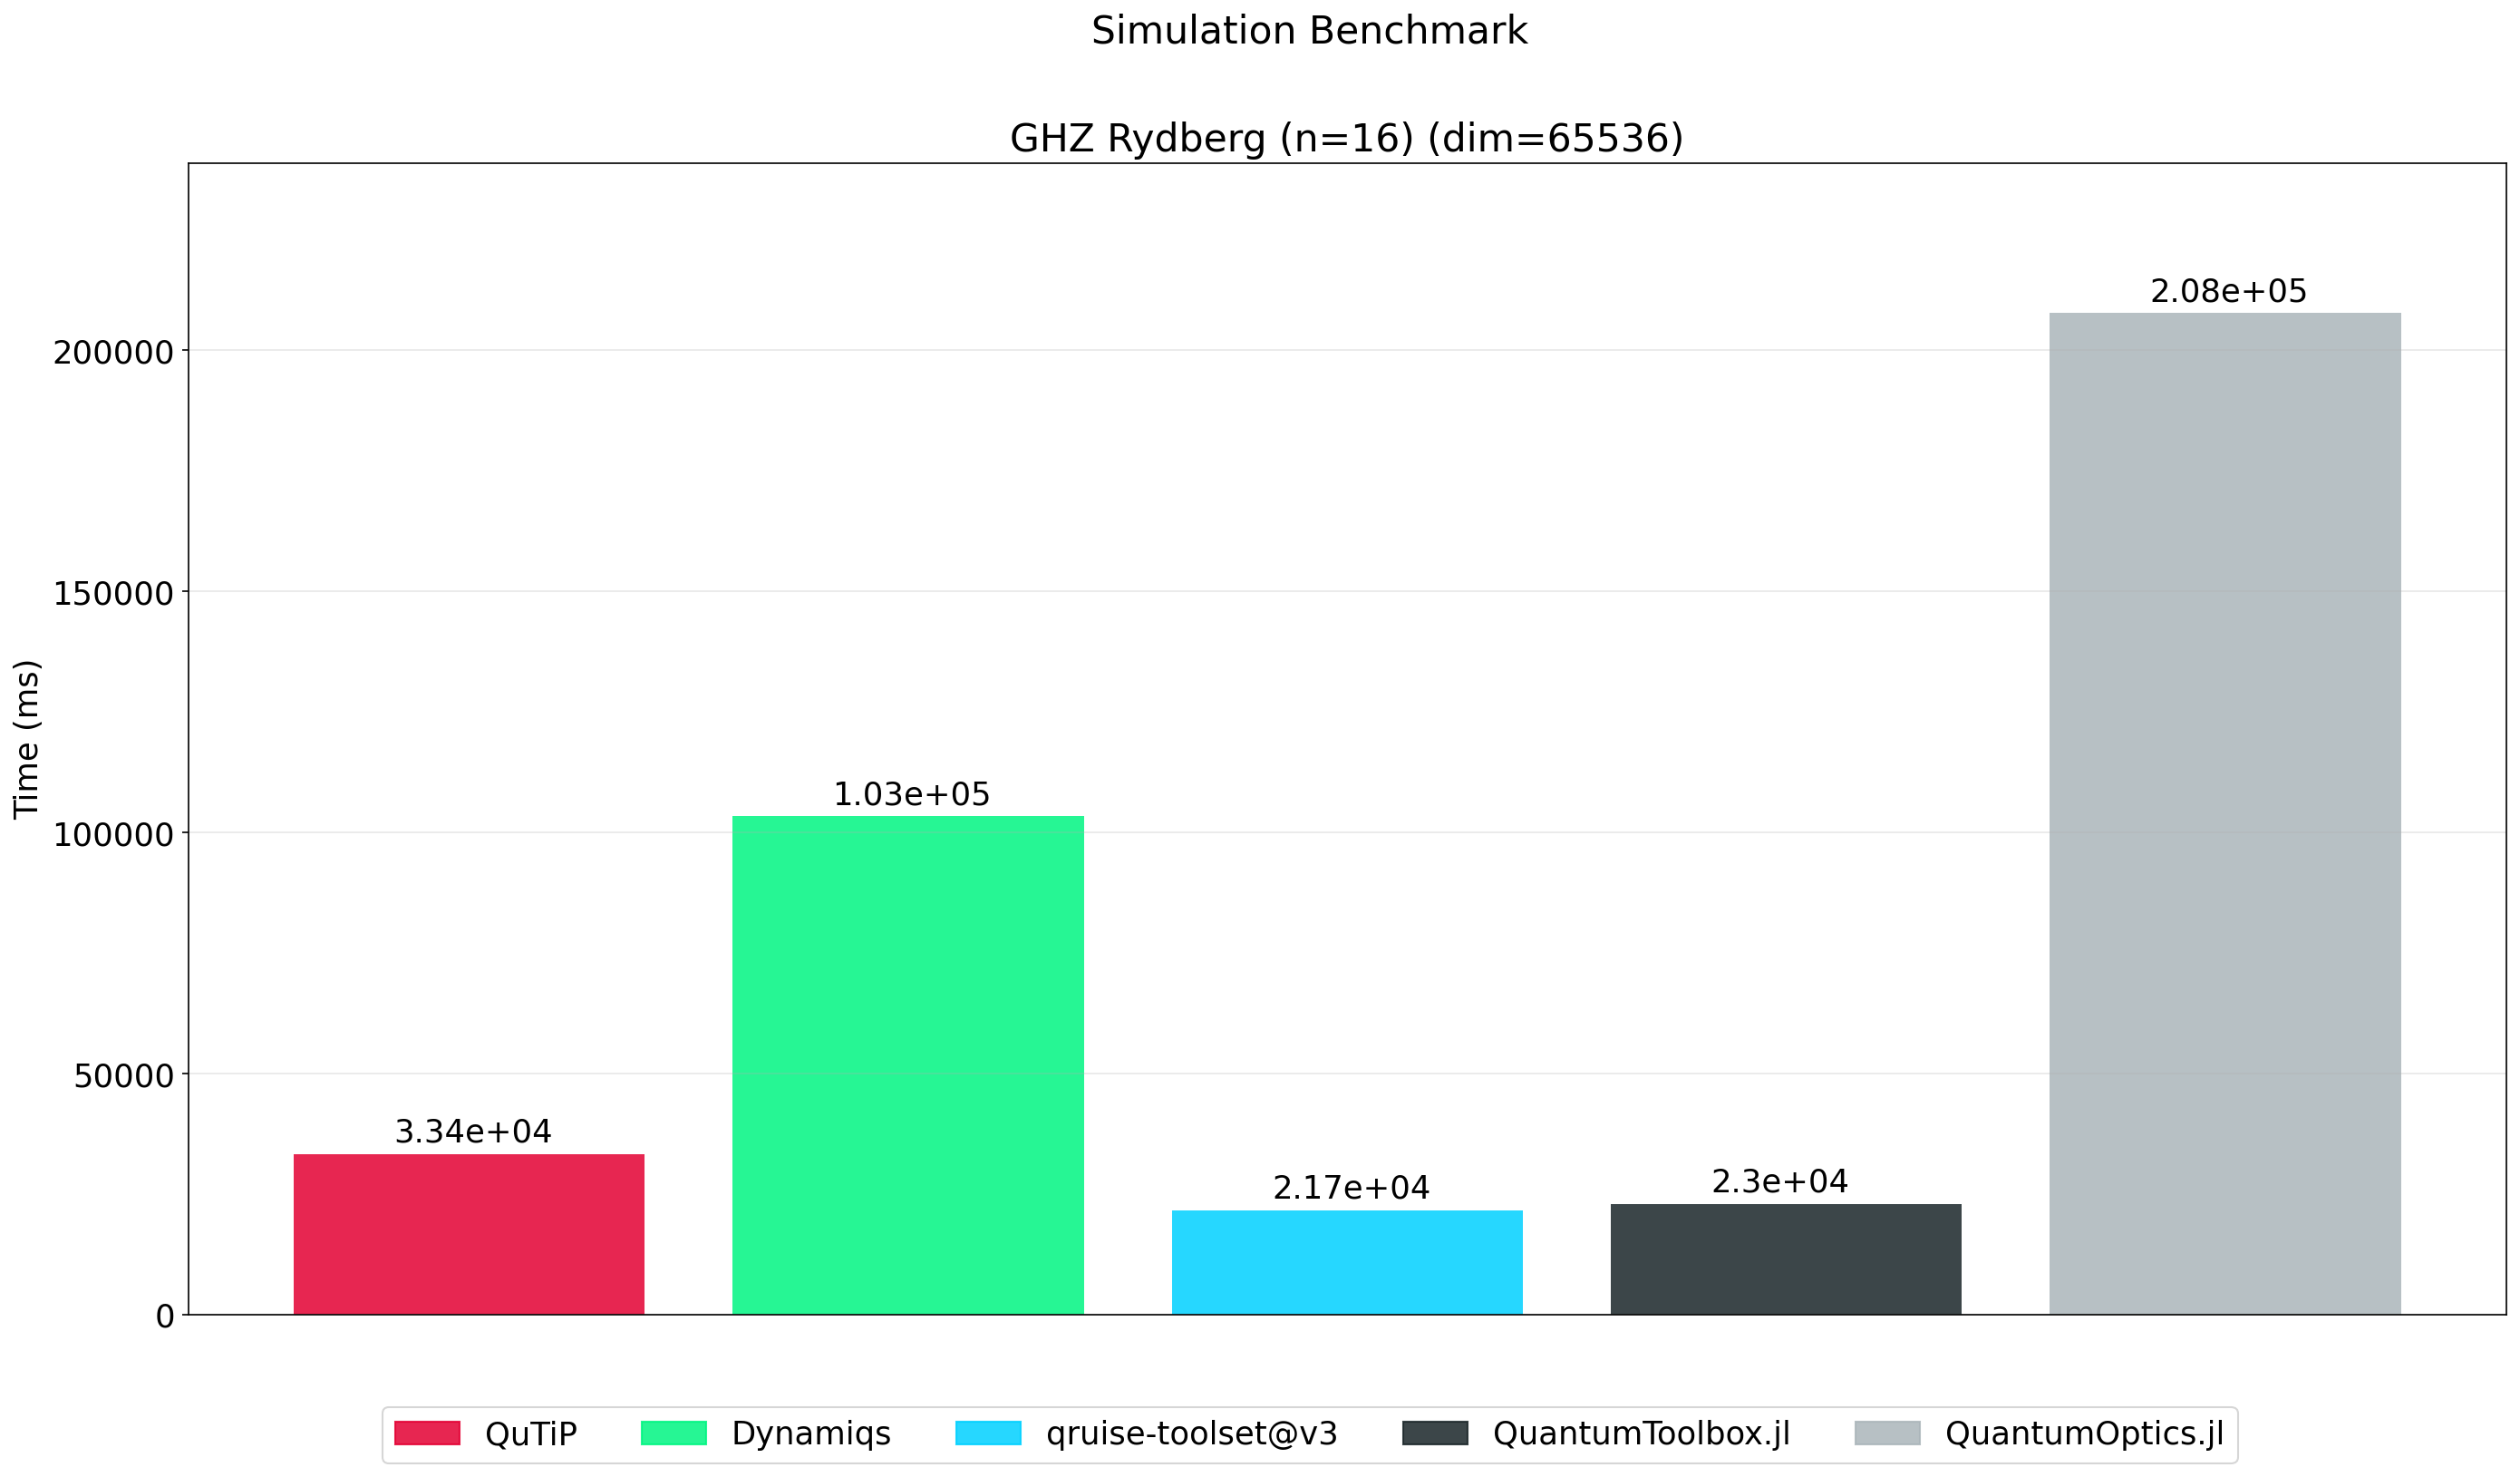
As the community moves from the NISQ to the FTQC era, there's increasing demand for modelling physically accurate system dynamics at the scale of standard QEC unit cells, i.e. 15–20 qubits. At the same time, an automatically differentiable simulator is needed for gate optimisation and parameter-learning workflows. Meeting these demands required a complete rethink of the software architecture. You can see below a preliminary benchmark comparing the performance of qruise-toolset@v3 with other libraries in the ecosystem.
QruiseOS
This focuses on enhancing the user dashboard experience, with new features and improvements across all main pages.
New features
Branch comparison and experiment links in System Info
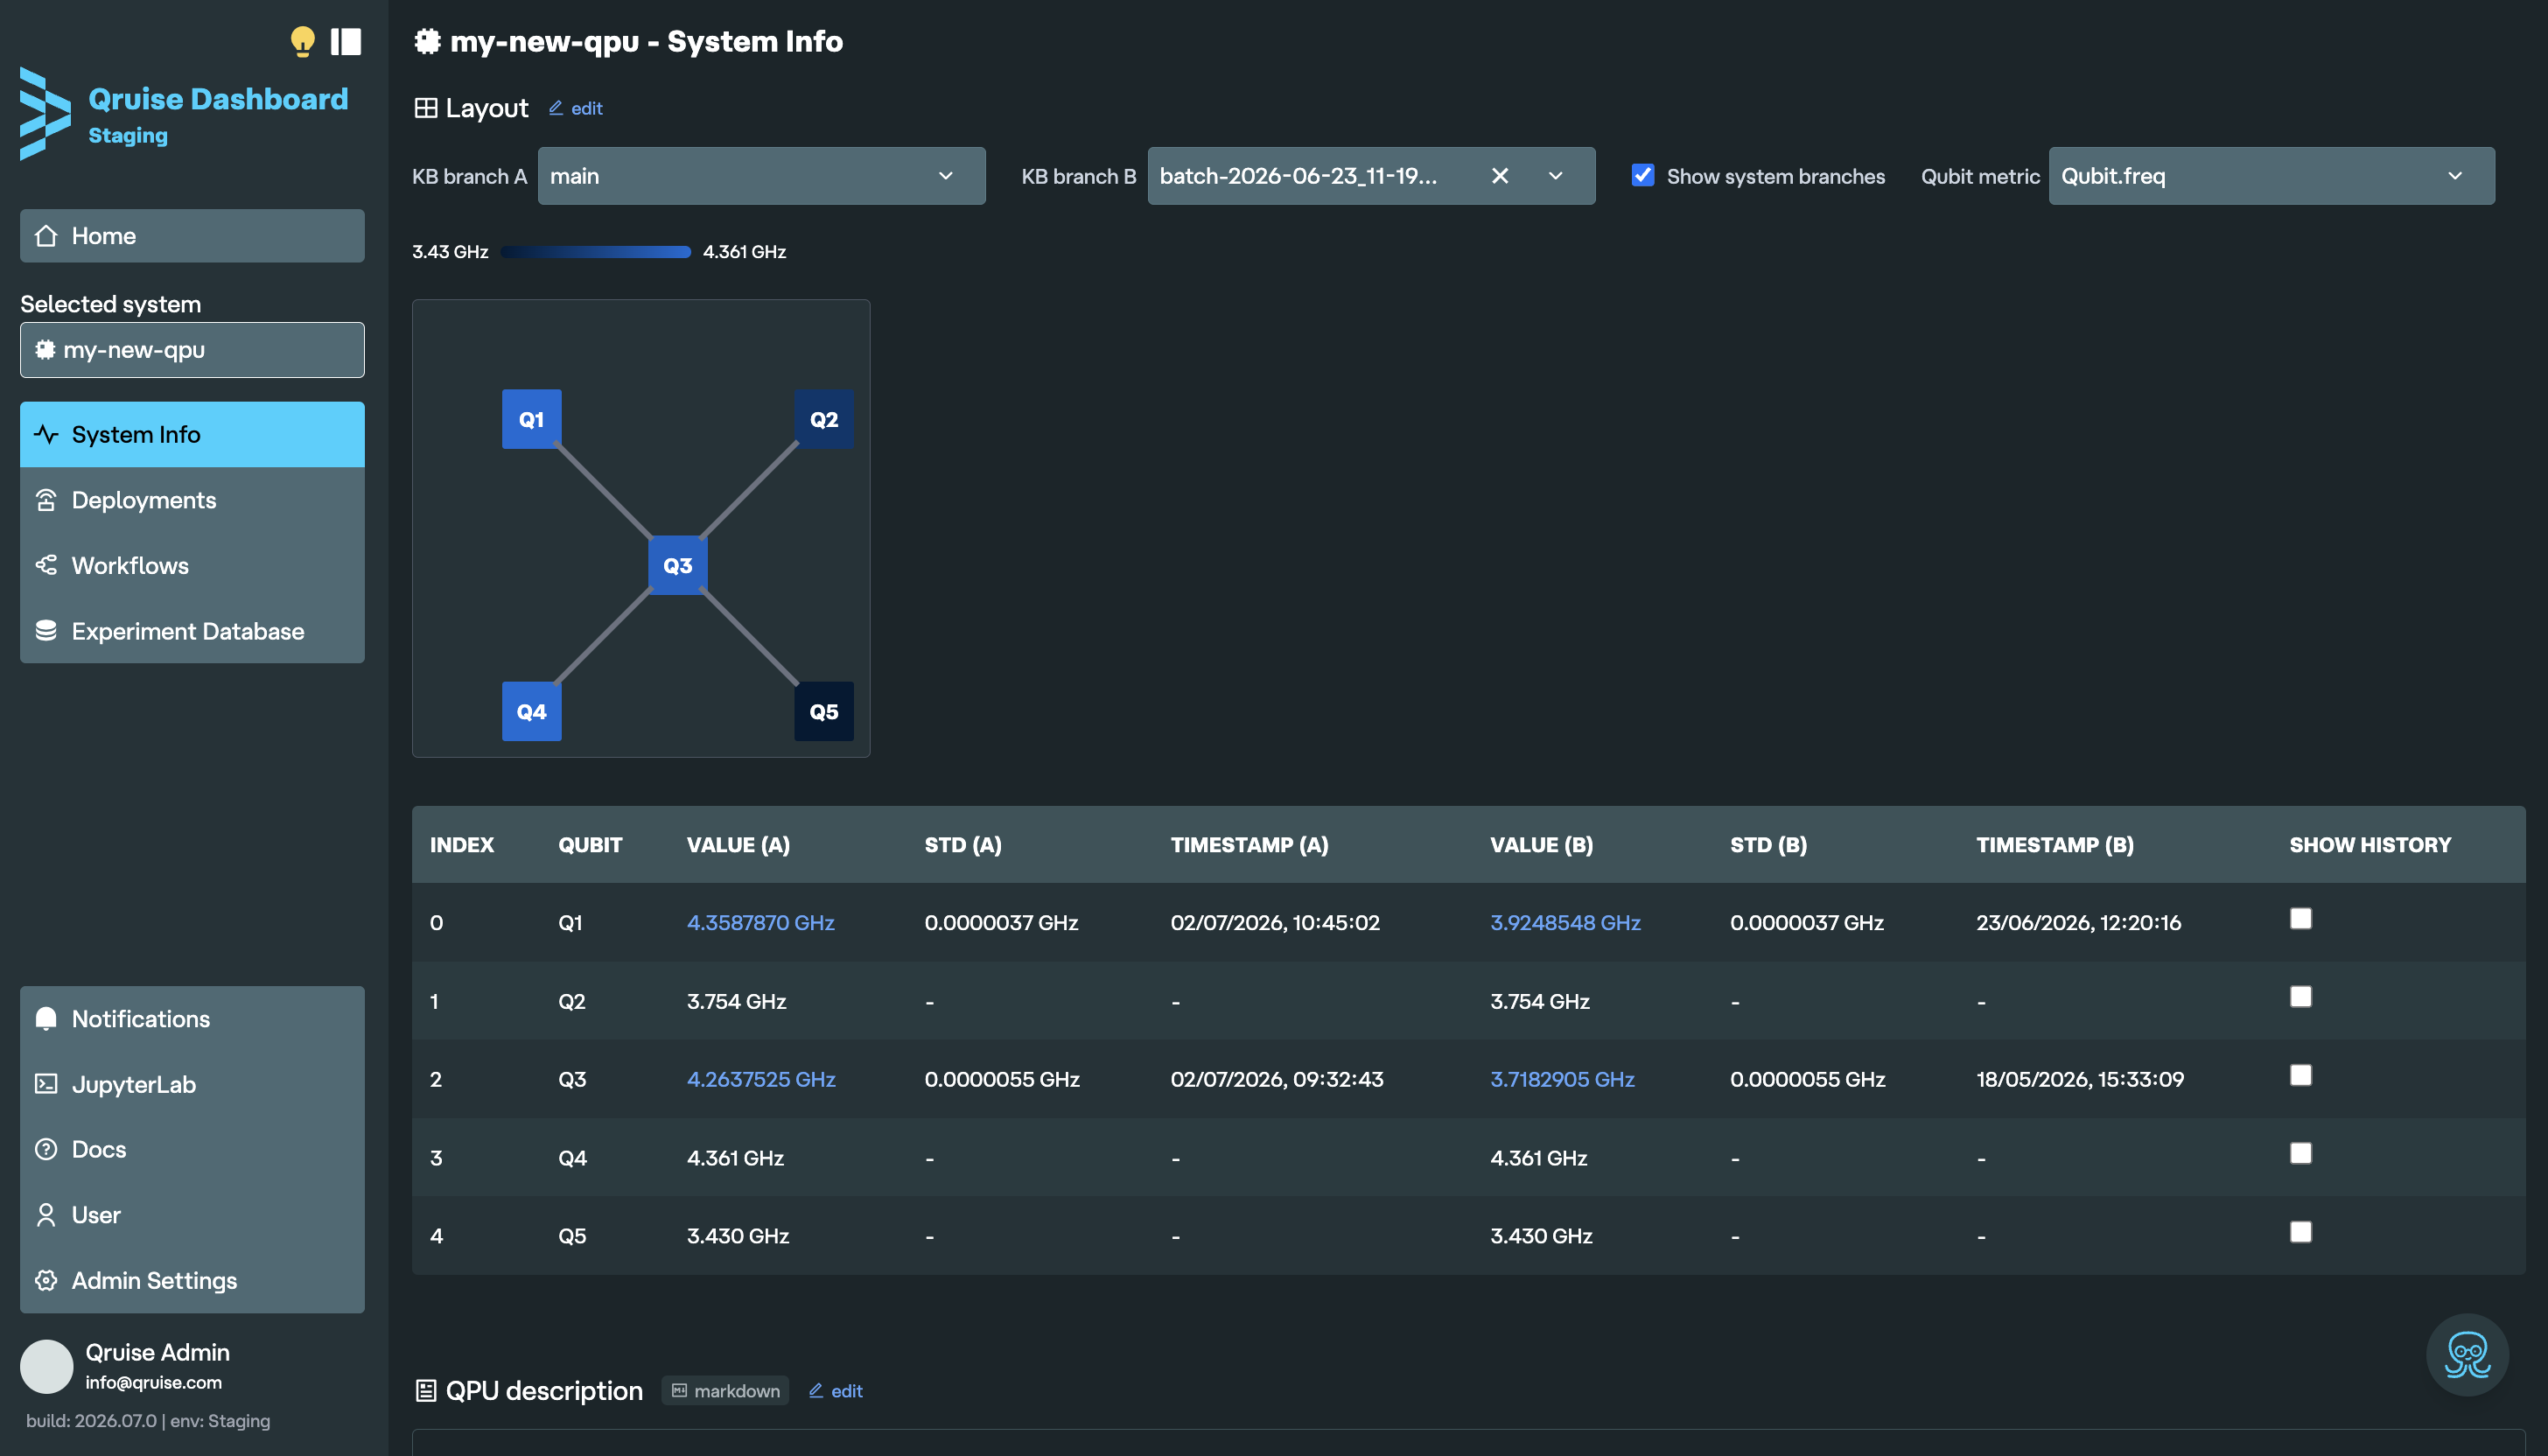
The System Info page now has the option to compare two experiment branches side-by-side, allowing you to easily compare different qubit metrics across branches. (Branching itself already existed; this release adds the side-by-side comparison view and extends branch tracking to flow runs, not just experiments.)
Qubit metrics now include links to the corresponding experiment in the database.
Summary table for experiments
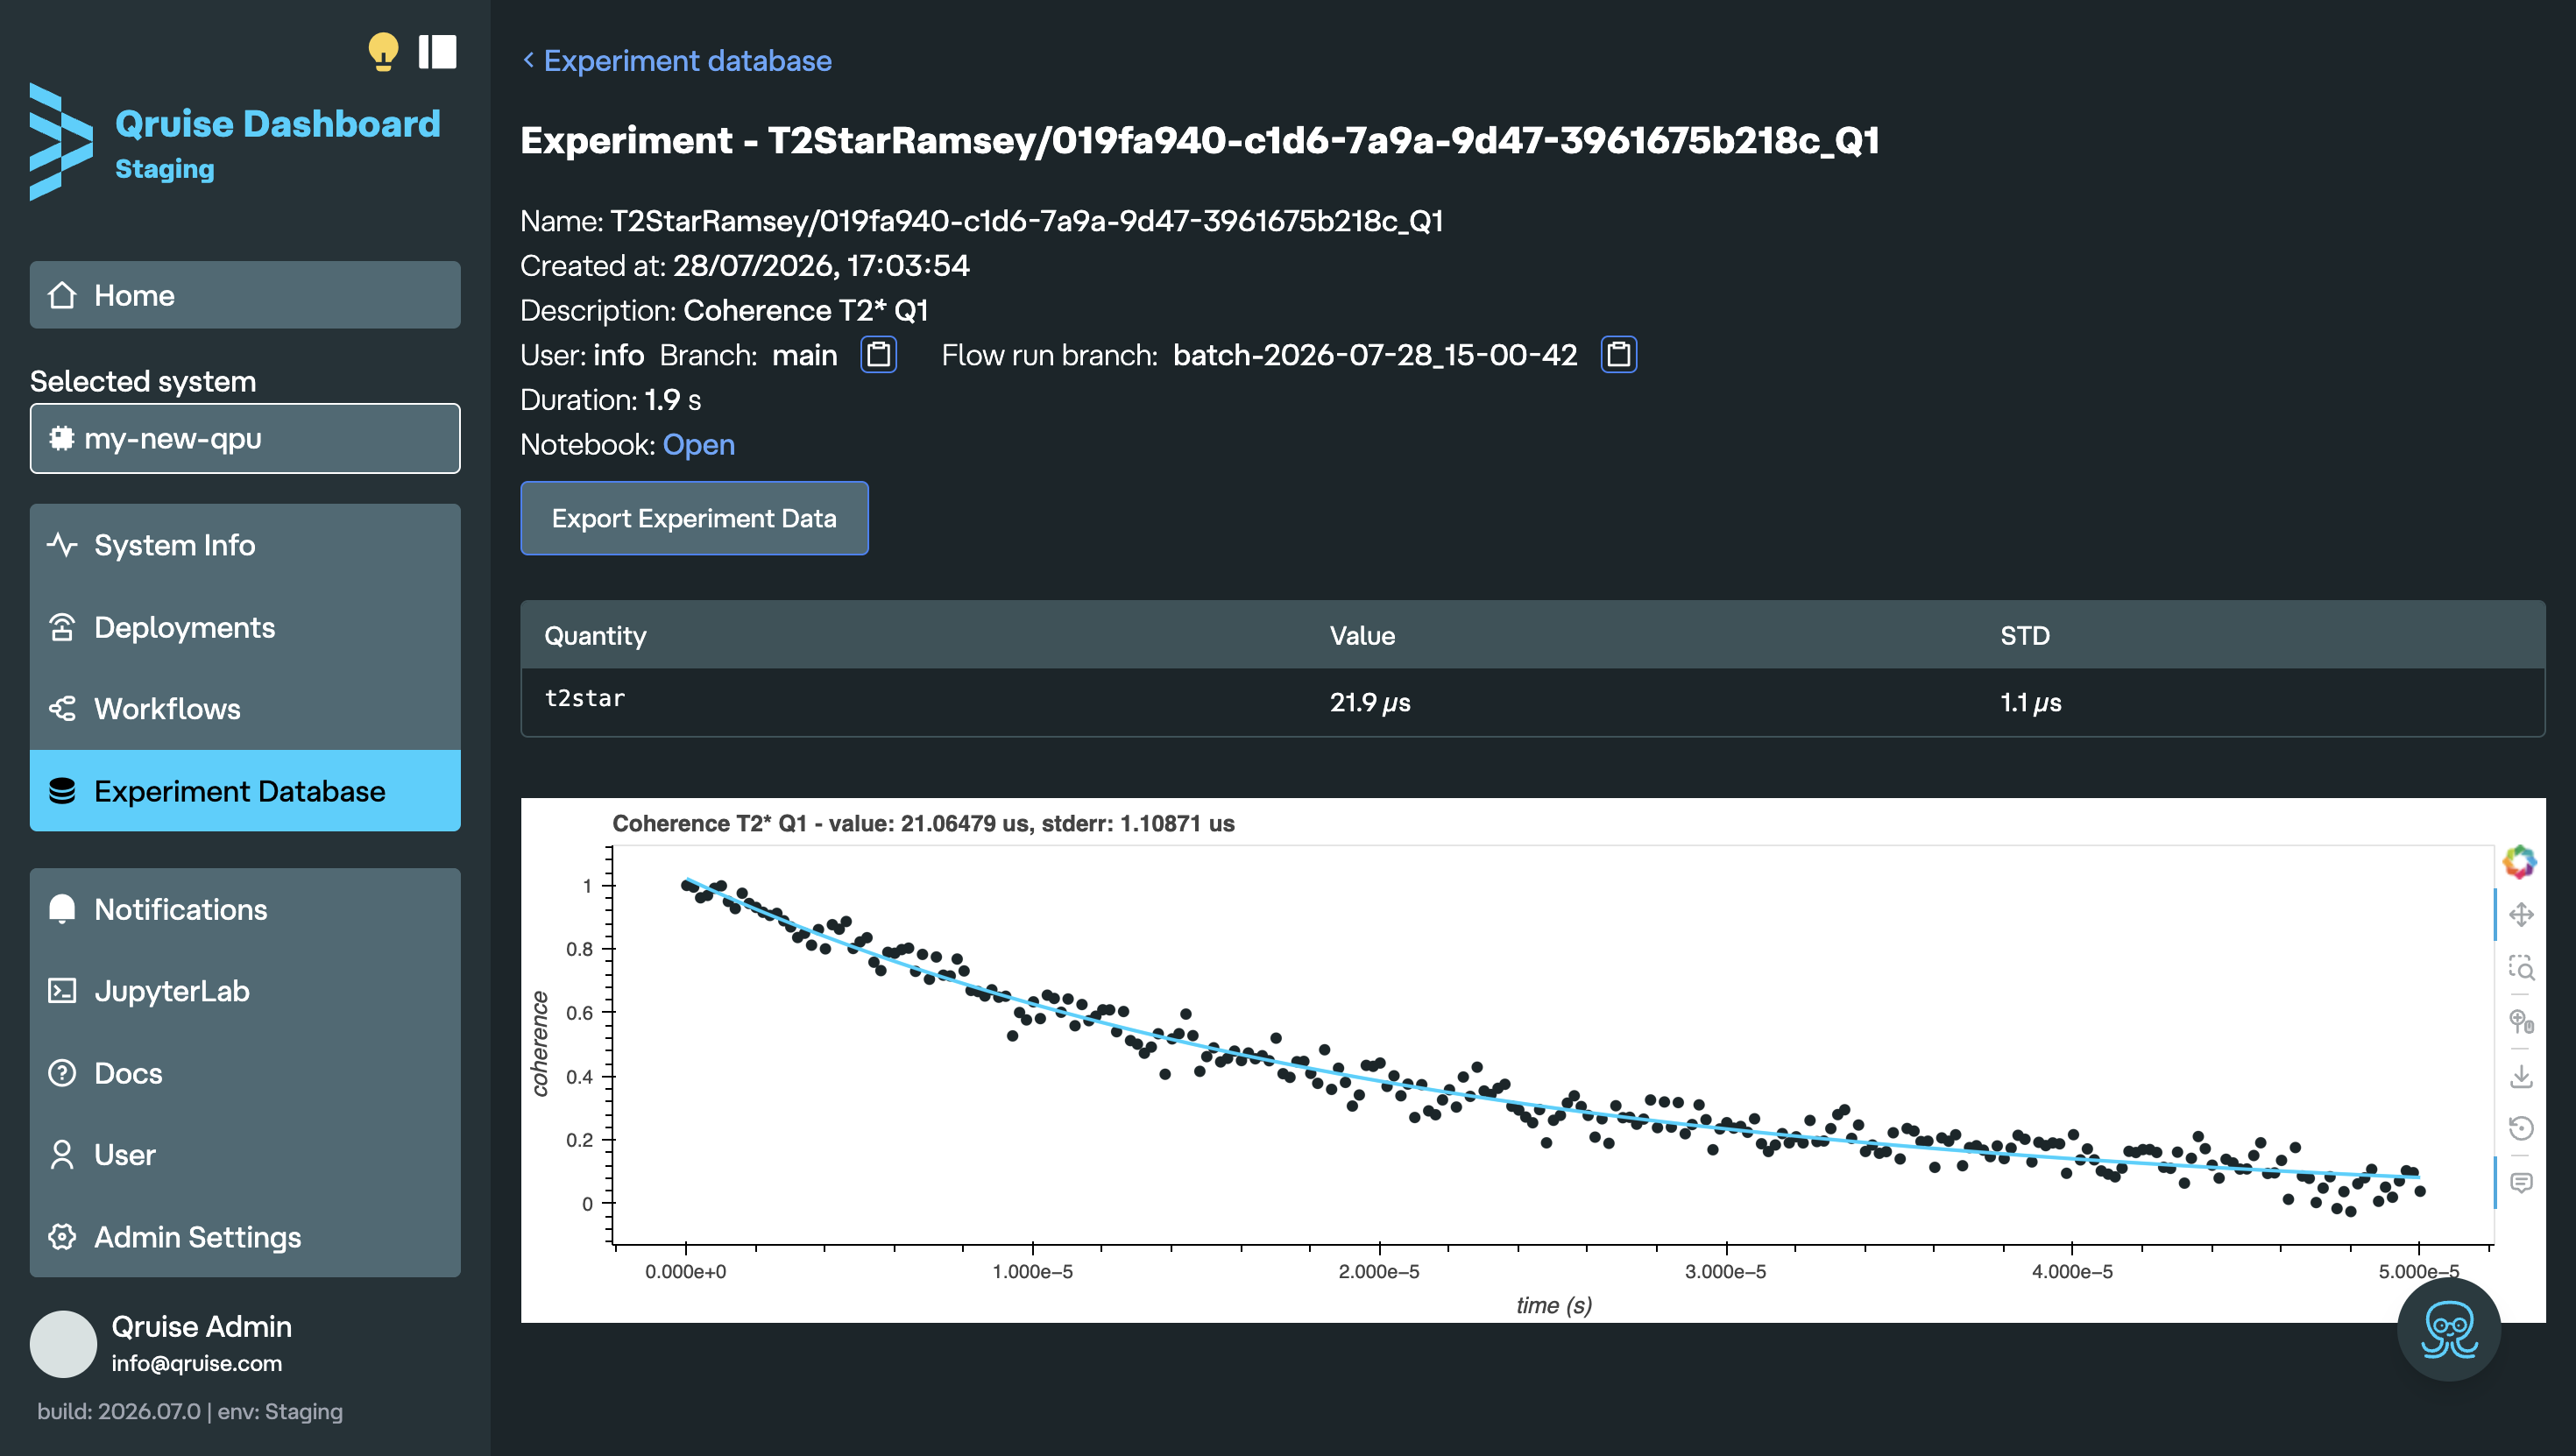
When viewing an experiment in either workflow view or the Experiment Database, you can now see a summary table of the metrics derived from that experiment.
QPU metric history
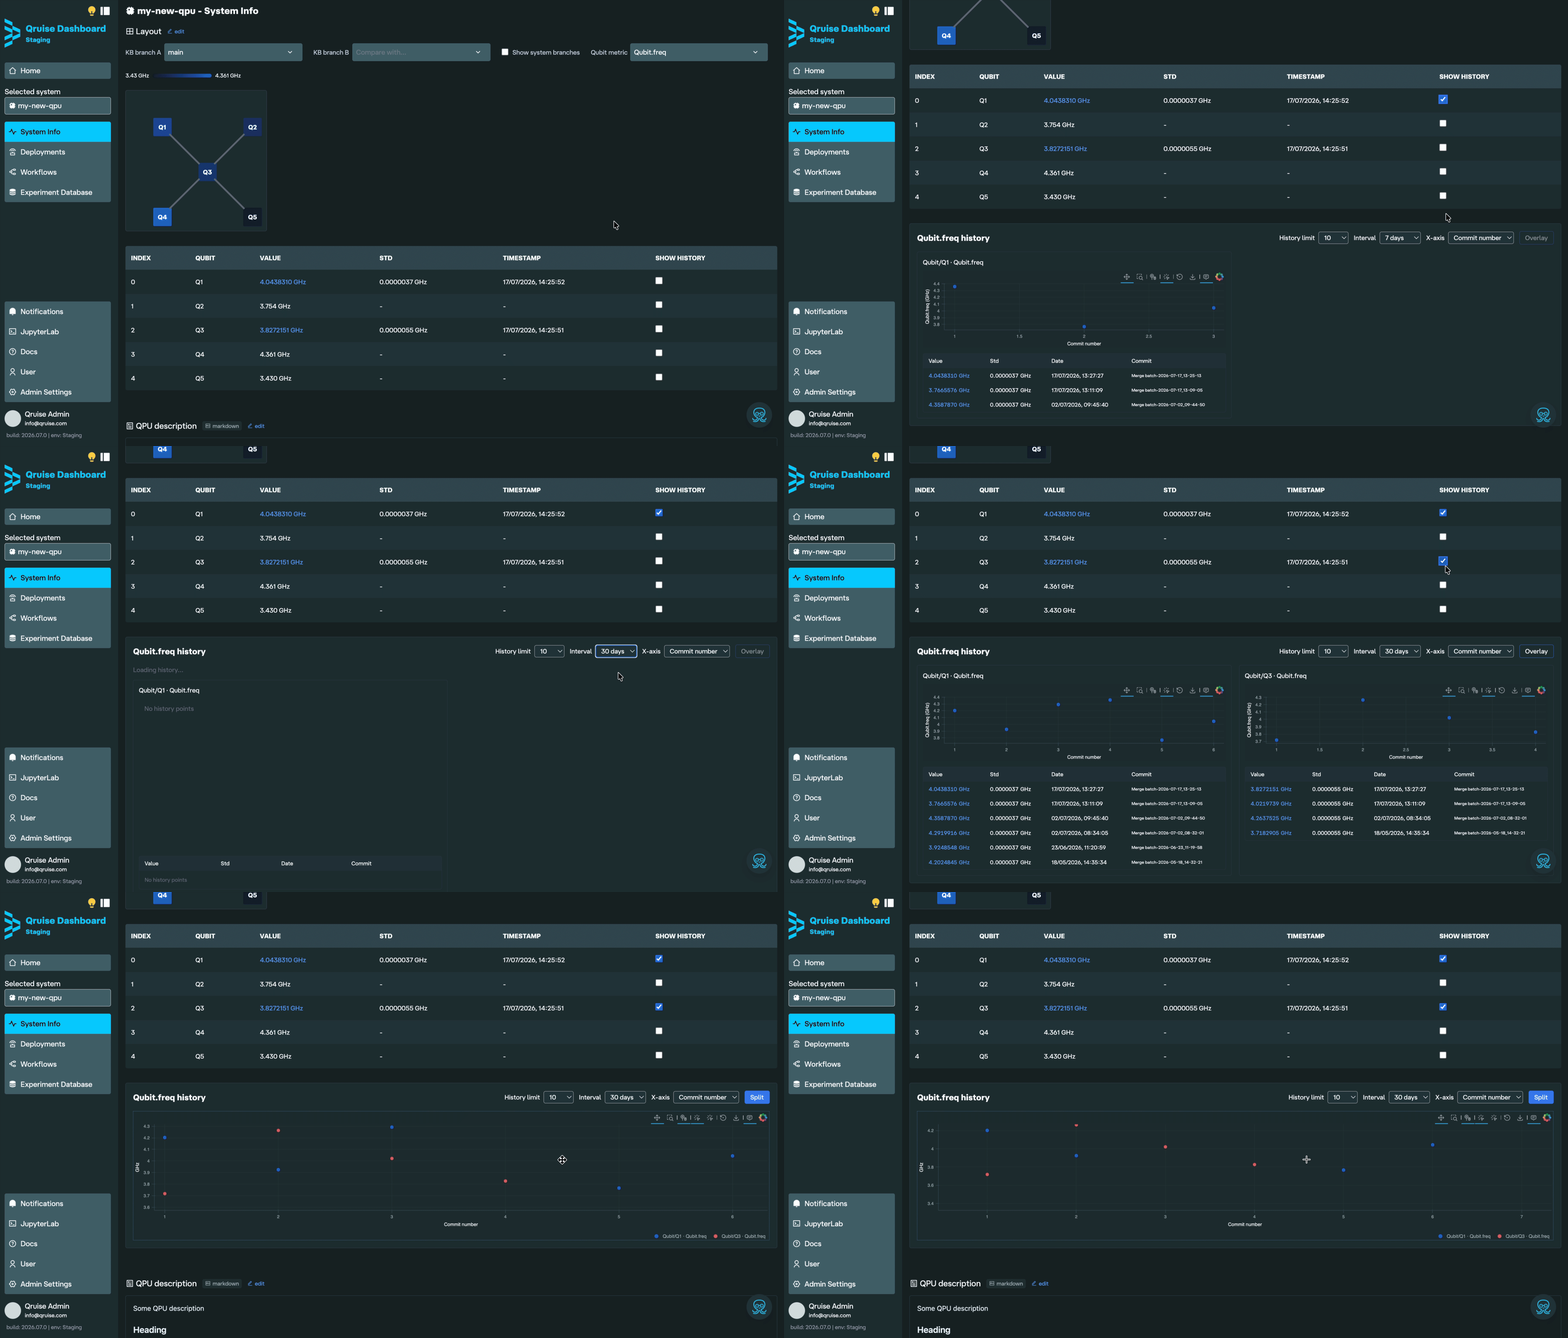
A new history view on the System Info page lets you track how your QPU metrics have evolved over time. You can select the maximum number of commits to view (history limit), the time interval, and whether the metric is plotted against the date or commit number. There's also an option to overlay the data from multiple qubits and branches for easier comparison.
Deployments in the dashboard
You can now run, edit, and schedule deployments in the dashboard, making it easier to manage deployments from a single interface.
Richer experiment data downloads
Experiment data exports now include a provenance.yaml file containing experiment, software, and version information, together with a snapshot of the QPU state (kb_snapshot.json) after the experiment completed. This makes it easier to reproduce and analyse results.
Improvements
More compact Experiment Database
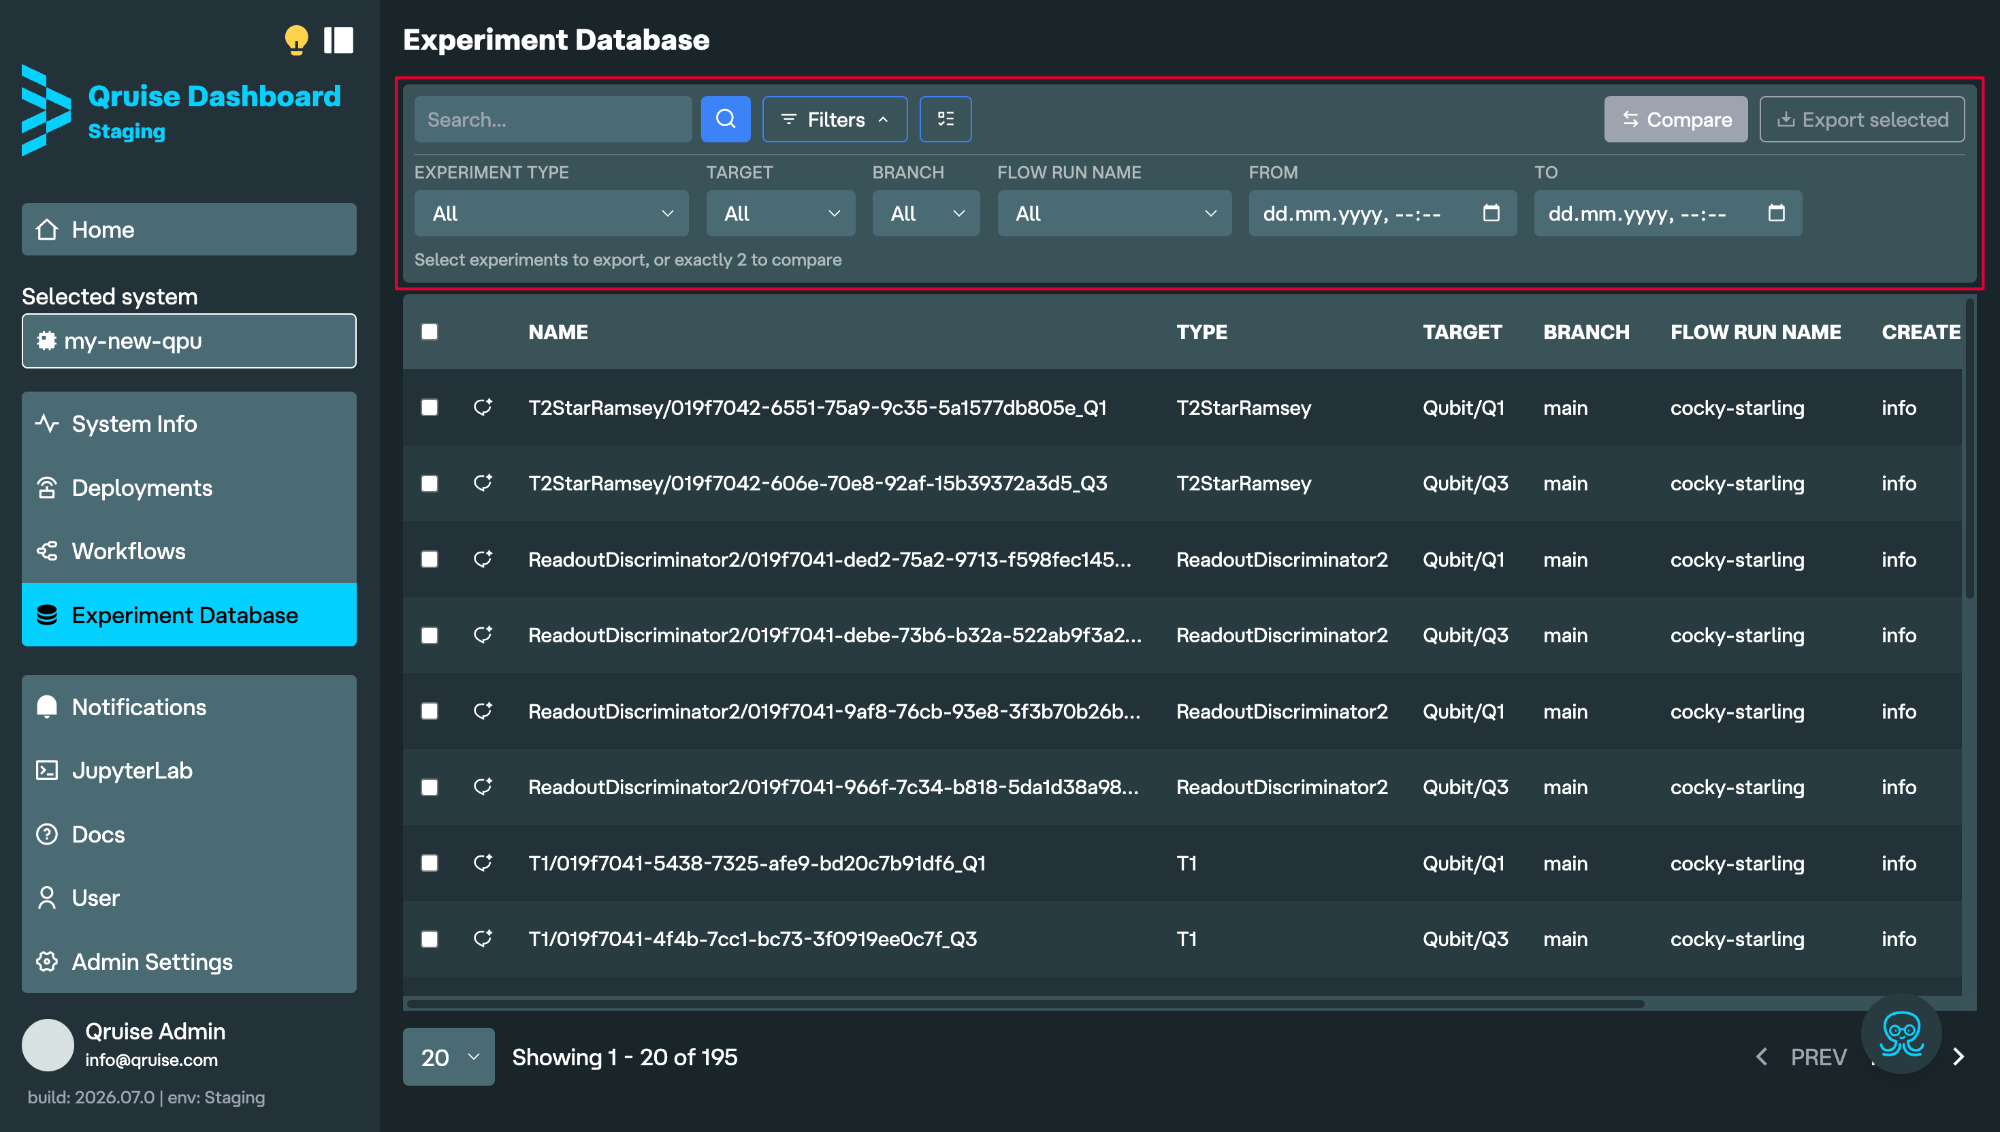
The Experiment Database has been redesigned with a more compact layout, sticky checkboxes, and a consolidated filter bar, making it easier to filter, compare, and export experiments. An additional compact view is also available for displaying more experiments on smaller screens.
Flow run branch visibility
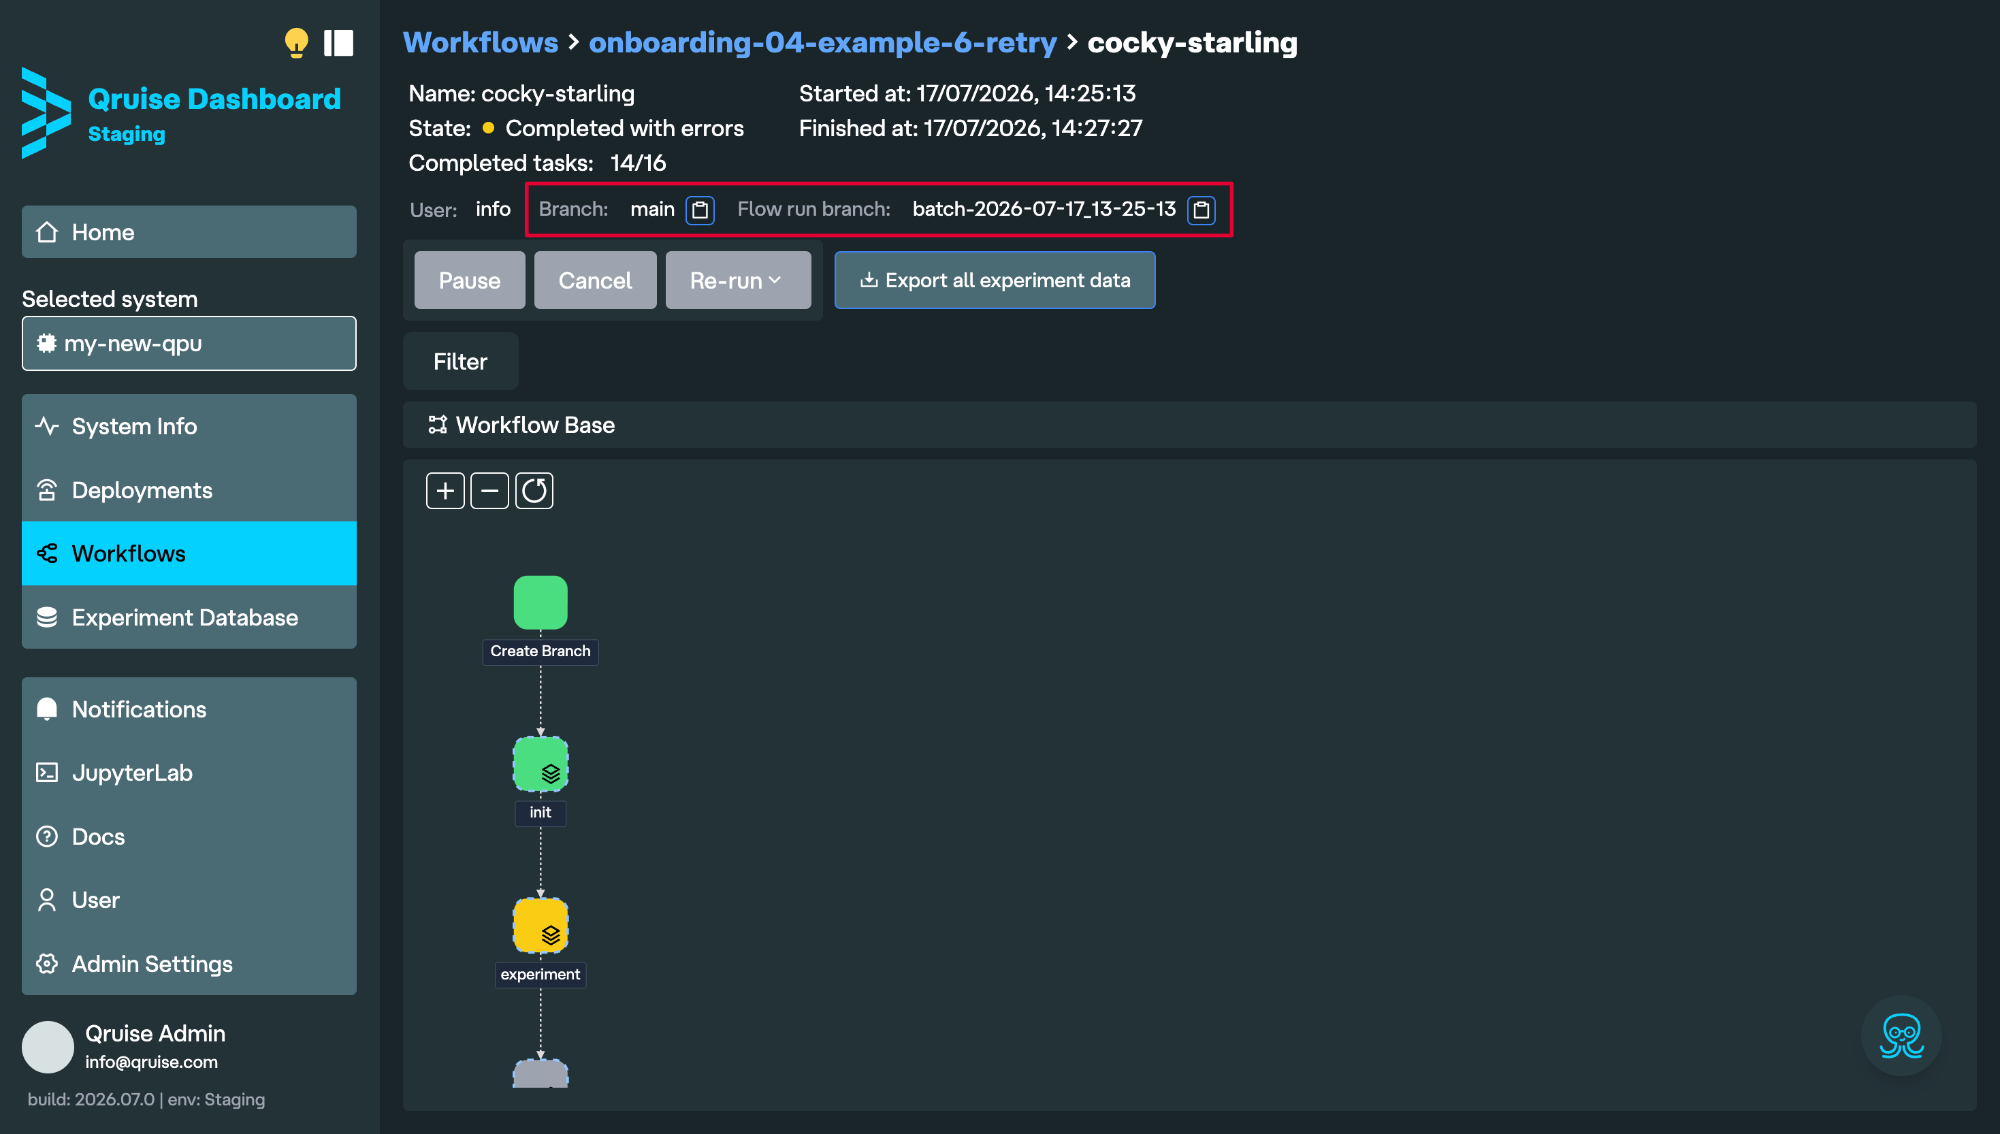
The flow run branch is now shown wherever flow runs are listed. Previously this was only shown in the Experiment Database.
Consolidated experiment addressing
The API and UI now use a single, consistent path to address experiments by name.
Bug Fixes
- Fixed a bug where users with no permitted QPUs could, in some cases, see runs and workflows belonging to other QPUs.
- Fixed intermittent JupyterHub connection errors.
Table of contents
QruiseMLQruiseOSNew featuresBranch comparison and experiment links in System InfoSummary table for experimentsQPU metric historyDeployments in the dashboardRicher experiment data downloadsImprovementsMore compact Experiment DatabaseFlow run branch visibilityConsolidated experiment addressingBug fixesStay informed with our newsletter
Subscribe to our newsletter to get the latest updates on our products and services.